|
Size: 43275
Comment:
|
Size: 44752
Comment:
|
| Deletions are marked like this. | Additions are marked like this. |
| Line 209: | Line 209: |
| num_html = "%s \cdot \\left[ %s \\right]" % (dx, ' + '.join([ str(cap(i)) for i in xs ])) | num_html = "%s \cdot \\left[ %s \\right]" % (dx, ' + '.join([ str(cap(i)) for i in ys ])) |
| Line 227: | Line 227: |
== Some polar parametric curves == by Marshall Hampton. This is not very general, but could be modified to show other families of polar curves. {{{ @interact def para(n1 = slider(1,5,1,default = 2), n2 = slider(1,5,1,default = 3), a1 = slider(1,10,1/10,6/5), a2 = slider(1,10,1/10,6), b = slider(0,2,1/50,0)): var('t') html('$r=' + latex(b+sin(a1*t)^n1 + cos(a2*t)^n2)+'$') p = parametric_plot((cos(t)*(b+sin(a1*t)^n1 + cos(a2*t)^n2), sin(t)*(b+sin(a1*t)^n1 + cos(a2*t)^n2)), (t,0, 20*pi), plot_points = 1024, rgbcolor = (0,0,0)) show(p, figsize = [5,5], xmin = -2-b, xmax = 2+b, ymin = -2-b, ymax = 2+b, axes = False) }}} {{attachment:polarcurves1.png}} |
|
| Line 555: | Line 568: |
| == Quadric Surface Plotter == by Marshall Hampton. This is pretty simple, so I encourage people to spruce it up. In particular, it isn't set up to show all possible types of quadrics. {{{ var('x,y,z') quadrics = {'Ellipsoid':x^2+y^2+z^2-1,'Elliptic paraboloid':x^2+y^2-z,'Hyperbolic paraboloid':x^2-y^2-z, '1-Sheeted Hyperboloid':x^2+y^2-z^2-1,'2-Sheeted Hyperboloid':x^2-y^2-z^2-1, 'Cone':x^2+y^2-z^2} @interact def quads(q = selector(quadrics.keys()), a = slider(0,5,1/2,default = 1)): f = quadrics[q].subs({x:x*a^(1/2)}) if a==0 or q=='Cone': html('<center>$'+latex(f)+' \ $'+ '(degenerate)</center>') else: html('<center>$'+latex(f)+'$ </center>') p = implicit_plot3d(f,(x,-2,2),(y,-2,2),(z,-2,2), plot_points = 75) show(p) }}} {{attachment:quadrics.png}} |
|
| Line 1061: | Line 1089: |
| var('xx yy', ns=1) | var('xx yy') |
Sage Interactions - Calculus
goto interact main page
Contents
-
Sage Interactions - Calculus
- Root Finding Using Bisection
- Newton's Method
- A contour map and 3d plot of two inverse distance functions
- A simple tangent line grapher
- Numerical integrals with the midpoint rule
- Numerical integrals with various rules
- Some polar parametric curves
- Function tool
- Newton-Raphson Root Finding
- Coordinate Transformations
- Taylor Series
- Illustration of the precise definition of a limit
- A graphical illustration of sin(x)/x -> 1 as x-> 0
- Quadric Surface Plotter
- The midpoint rule for numerically integrating a function of two variables
- Gaussian (Legendre) quadrature
- Vector Calculus, 2-D Motion
- Vector Calculus, 3-D Motion
- Directional Derivatives
- 3D graph with points and curves
- Approximating function in two variables by differential
- Taylor approximations in two variables
Root Finding Using Bisection
by William Stein
def bisect_method(f, a, b, eps):
    try:
        f = f._fast_float_(f.variables()[0])
    except AttributeError:
        pass
    intervals = [(a,b)]
    two = float(2); eps = float(eps)
    while True:
        c = (a+b)/two
        fa = f(a); fb = f(b); fc = f(c)
        if abs(fc) < eps: return c, intervals
        if fa*fc < 0:
            a, b = a, c
        elif fc*fb < 0:
            a, b = c, b
        else:
            raise ValueError, "f must have a sign change in the interval (%s,%s)"%(a,b)
        intervals.append((a,b))
html("<h1>Double Precision Root Finding Using Bisection</h1>")
@interact
def _(f = cos(x) - x, a = float(0), b = float(1), eps=(-3,(-16..-1))):
     eps = 10^eps
     print "eps = %s"%float(eps)
     try:
         time c, intervals = bisect_method(f, a, b, eps)
     except ValueError:
         print "f must have opposite sign at the endpoints of the interval"
         show(plot(f, a, b, color='red'), xmin=a, xmax=b)
     else:
         print "root =", c
         print "f(c) = %r"%f(c)
         print "iterations =", len(intervals)
         P = plot(f, a, b, color='red')
         h = (P.ymax() - P.ymin())/ (1.5*len(intervals))
         L = sum(line([(c,h*i), (d,h*i)]) for i, (c,d) in enumerate(intervals) )
         L += sum(line([(c,h*i-h/4), (c,h*i+h/4)]) for i, (c,d) in enumerate(intervals) )
         L += sum(line([(d,h*i-h/4), (d,h*i+h/4)]) for i, (c,d) in enumerate(intervals) )
         show(P + L, xmin=a, xmax=b)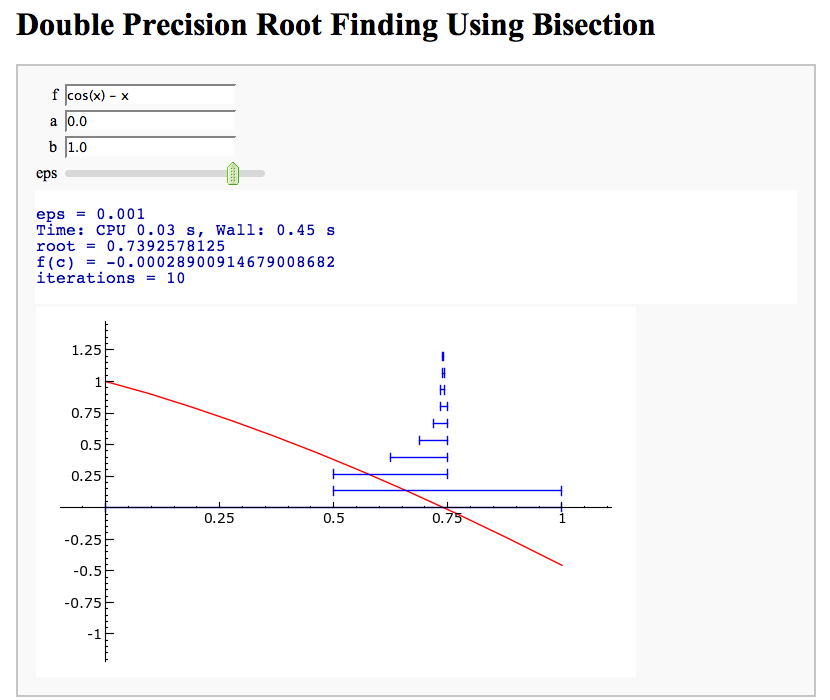
Newton's Method
Note that there is a more complicated Newton's method below.
by William Stein
def newton_method(f, c, eps, maxiter=100):
    x = f.variables()[0]
    fprime = f.derivative(x)
    try:
        g = f._fast_float_(x)
        gprime = fprime._fast_float_(x)
    except AttributeError:
        g = f; gprime = fprime
    iterates = [c]
    for i in xrange(maxiter):
       fc = g(c)
       if abs(fc) < eps: return c, iterates
       c = c - fc/gprime(c)
       iterates.append(c)
    return c, iterates
html("<h1>Double Precision Root Finding Using Newton's Method</h1>")
@interact
def _(f = x^2 - 2, c = float(0.5), eps=(-3,(-16..-1)), interval=float(0.5)):
     eps = 10^(eps)
     print "eps = %s"%float(eps)
     time z, iterates = newton_method(f, c, eps)
     print "root =", z
     print "f(c) = %r"%f(z)
     n = len(iterates)
     print "iterations =", n
     html(iterates)
     P = plot(f, z-interval, z+interval, rgbcolor='blue')
     h = P.ymax(); j = P.ymin()
     L = sum(point((w,(n-1-float(i))/n*h), rgbcolor=(float(i)/n,0.2,0.3), pointsize=10) + \
             line([(w,h),(w,j)],rgbcolor='black',thickness=0.2) for i,w in enumerate(iterates))
     show(P + L, xmin=z-interval, xmax=z+interval)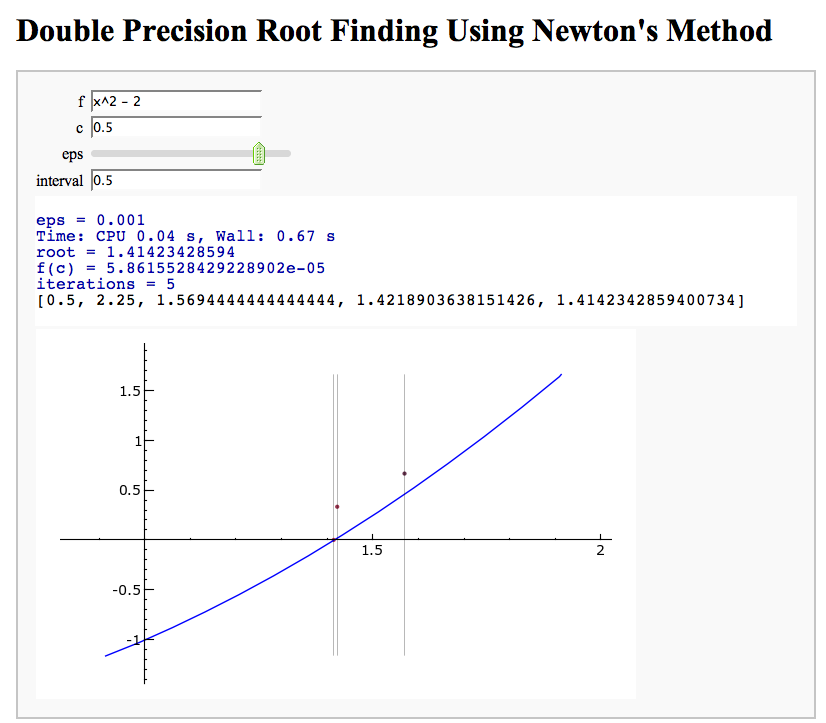
A contour map and 3d plot of two inverse distance functions
by William Stein
@interact
def _(q1=(-1,(-3,3)), q2=(-2,(-3,3)),
      cmap=['autumn', 'bone', 'cool', 'copper', 'gray', 'hot', 'hsv',
           'jet', 'pink', 'prism', 'spring', 'summer', 'winter']):
     x,y = var('x,y')
     f = q1/sqrt((x+1)^2 + y^2) + q2/sqrt((x-1)^2+(y+0.5)^2)
     C = contour_plot(f, (-2,2), (-2,2), plot_points=30, contours=15, cmap=cmap)
     show(C, figsize=3, aspect_ratio=1)
     show(plot3d(f, (x,-2,2), (y,-2,2)), figsize=5, viewer='tachyon')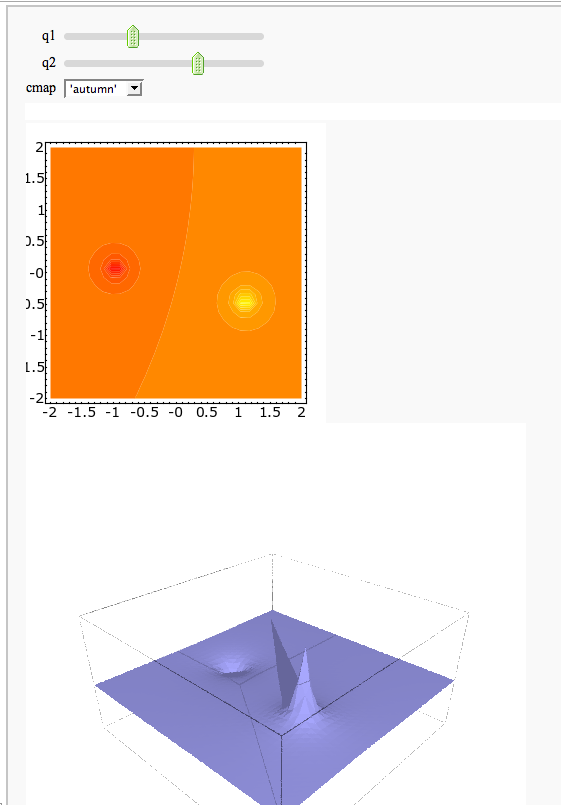
A simple tangent line grapher
by Marshall Hampton
html('<h2>Tangent line grapher</h2>')
@interact
def tangent_line(f = input_box(default=sin(x)), xbegin = slider(0,10,1/10,0), xend = slider(0,10,1/10,10), x0 = slider(0, 1, 1/100, 1/2)):
    prange = [xbegin, xend]
    x0i = xbegin + x0*(xend-xbegin)
    var('x')
    df = diff(f)
    tanf = f(x0i) + df(x0i)*(x-x0i)
    fplot = plot(f, prange[0], prange[1])
    print 'Tangent line is y = ' + tanf._repr_()
    tanplot = plot(tanf, prange[0], prange[1], rgbcolor = (1,0,0))
    fmax = f.find_maximum_on_interval(prange[0], prange[1])[0]
    fmin = f.find_minimum_on_interval(prange[0], prange[1])[0]
    show(fplot + tanplot, xmin = prange[0], xmax = prange[1], ymax = fmax, ymin = fmin)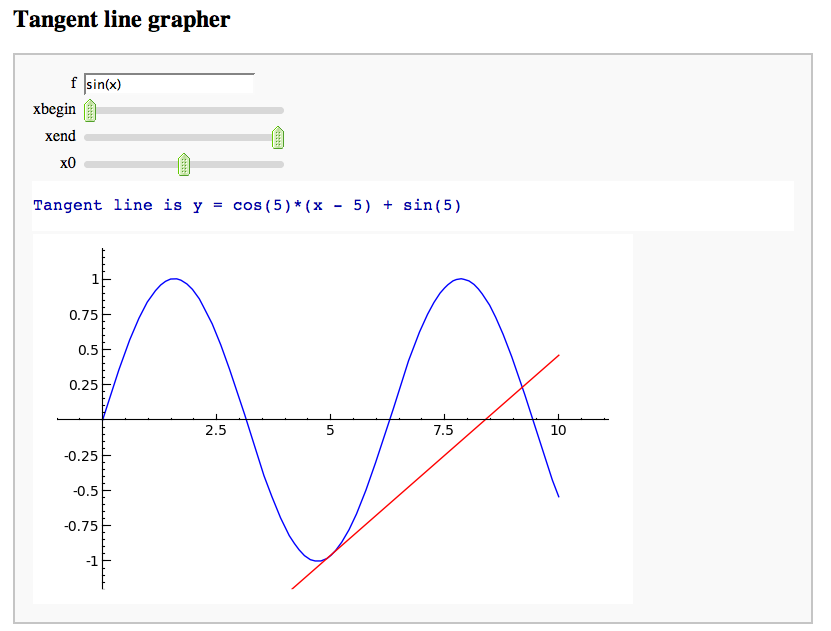
Numerical integrals with the midpoint rule
by Marshall Hampton
var('x')
@interact
def midpoint(n = slider(1,100,1,4), f = input_box(default = "x^2", type = str), start = input_box(default = "0", type = str), end = input_box(default = "1", type = str)):
    a = N(start)
    b = N(end)
    func = sage_eval(f, locals={'x':x})
    dx = (b-a)/n
    midxs = [q*dx+dx/2 + a for q in range(n)]
    midys = [func(x_val) for x_val in midxs]
    rects = Graphics()
    for q in range(n):
        xm = midxs[q]
        ym = midys[q]
        rects = rects + line([[xm-dx/2,0],[xm-dx/2,ym],[xm+dx/2,ym],[xm+dx/2,0]], rgbcolor = (1,0,0)) + point((xm,ym), rgbcolor = (1,0,0))
    min_y = find_minimum_on_interval(func,a,b)[0]
    max_y = find_maximum_on_interval(func,a,b)[0]
    html('<h3>Numerical integrals with the midpoint rule</h3>')
    html('$\int_{a}^{b}{f(x) dx} {\\approx} \sum_i{f(x_i) \Delta x}$')
    print "\n\nSage numerical answer: " + str(integral_numerical(func,a,b,max_points = 200)[0])
    print "Midpoint estimated answer: " + str(RDF(dx*sum([midys[q] for q in range(n)])))
    show(plot(func,a,b) + rects, xmin = a, xmax = b, ymin = min_y, ymax = max_y)
Numerical integrals with various rules
by Nick Alexander (based on the work of Marshall Hampton)
# by Nick Alexander (based on the work of Marshall Hampton)

var('x')
@interact
def midpoint(f = input_box(default = sin(x^2) + 2, type = SR),
    interval=range_slider(0, 10, 1, default=(0, 4), label="Interval"),
    number_of_subdivisions = slider(1, 20, 1, default=4, label="Number of boxes"),
    endpoint_rule = selector(['Midpoint', 'Left', 'Right', 'Upper', 'Lower'], nrows=1, label="Endpoint rule")):

    a, b = map(QQ, interval)
    t = sage.calculus.calculus.var('t')
    func = fast_callable(f(x=t), RDF, vars=[t])
    dx = ZZ(b-a)/ZZ(number_of_subdivisions)

    xs = []
    ys = []
    for q in range(number_of_subdivisions):
        if endpoint_rule == 'Left':
            xs.append(q*dx + a)
        elif endpoint_rule == 'Midpoint':
            xs.append(q*dx + a + dx/2)
        elif endpoint_rule == 'Right':
            xs.append(q*dx + a + dx)
        elif endpoint_rule == 'Upper':
            x = find_maximum_on_interval(func, q*dx + a, q*dx + dx + a)[1]
            xs.append(x)
        elif endpoint_rule == 'Lower':
            x = find_minimum_on_interval(func, q*dx + a, q*dx + dx + a)[1]
            xs.append(x)
    ys = [ func(x) for x in xs ]

    rects = Graphics()
    for q in range(number_of_subdivisions):
        xm = q*dx + dx/2 + a
        x = xs[q]
        y = ys[q]
        rects += line([[xm-dx/2,0],[xm-dx/2,y],[xm+dx/2,y],[xm+dx/2,0]], rgbcolor = (1,0,0))
        rects += point((x, y), rgbcolor = (1,0,0))
    min_y = min(0, find_minimum_on_interval(func,a,b)[0])
    max_y = max(0, find_maximum_on_interval(func,a,b)[0])

    # html('<h3>Numerical integrals with the midpoint rule</h3>')
    show(plot(func,a,b) + rects, xmin = a, xmax = b, ymin = min_y, ymax = max_y)

    def cap(x):
        # print only a few digits of precision
        if x < 1e-4:
            return 0
        return RealField(20)(x)
    sum_html = "%s \cdot \\left[ %s \\right]" % (dx, ' + '.join([ "f(%s)" % cap(i) for i in xs ]))
    num_html = "%s \cdot \\left[ %s \\right]" % (dx, ' + '.join([ str(cap(i)) for i in ys ]))

    numerical_answer = integral_numerical(func,a,b,max_points = 200)[0]
    estimated_answer = dx * sum([ ys[q] for q in range(number_of_subdivisions)])

    html(r'''
    <div class="math">
    \begin{align*}
      \int_{a}^{b} {f(x) \, dx} & = %s \\\
      \sum_{i=1}^{%s} {f(x_i) \, \Delta x}
      & = %s \\\
      & = %s \\\
      & = %s .
    \end{align*}
    </div>
    ''' % (numerical_answer, number_of_subdivisions, sum_html, num_html, estimated_answer))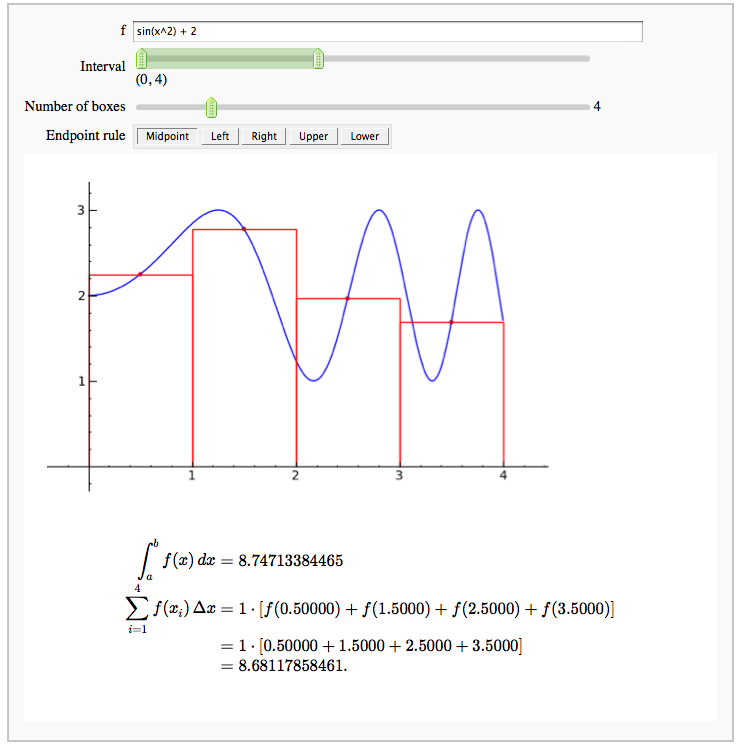
Some polar parametric curves
by Marshall Hampton. This is not very general, but could be modified to show other families of polar curves.
@interact
def para(n1 = slider(1,5,1,default = 2), n2 = slider(1,5,1,default = 3), a1 = slider(1,10,1/10,6/5), a2 = slider(1,10,1/10,6), b = slider(0,2,1/50,0)):
    var('t')
    html('$r=' + latex(b+sin(a1*t)^n1 + cos(a2*t)^n2)+'$')
    p = parametric_plot((cos(t)*(b+sin(a1*t)^n1 + cos(a2*t)^n2), sin(t)*(b+sin(a1*t)^n1 + cos(a2*t)^n2)), (t,0, 20*pi), plot_points = 1024, rgbcolor = (0,0,0))
    show(p, figsize = [5,5], xmin = -2-b, xmax = 2+b, ymin = -2-b, ymax = 2+b, axes = False)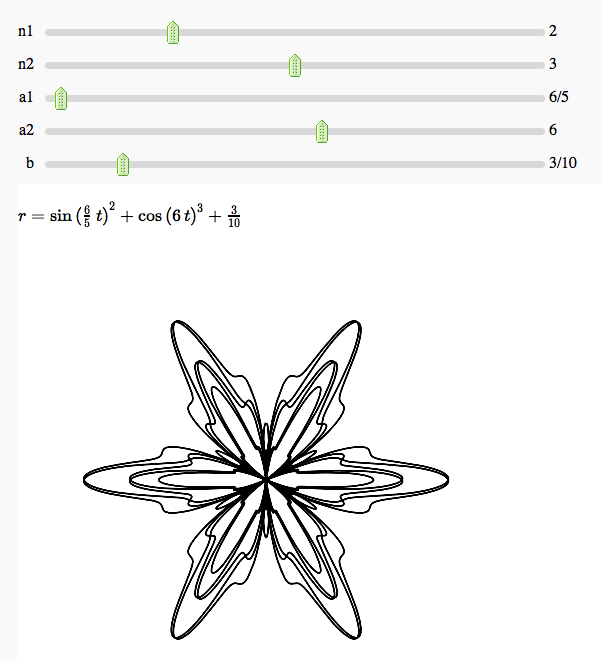
Function tool
Enter symbolic functions f, g, and a, a range, then click the appropriate button to compute and plot some combination of f, g, and a along with f and g. This is inspired by the Matlab funtool GUI.
x = var('x')
@interact
def _(f=sin(x), g=cos(x), xrange=input_box((0,1)), yrange='auto', a=1,
      action=selector(['f', 'df/dx', 'int f', 'num f', 'den f', '1/f', 'finv',
                       'f+a', 'f-a', 'f*a', 'f/a', 'f^a', 'f(x+a)', 'f(x*a)',
                       'f+g', 'f-g', 'f*g', 'f/g', 'f(g)'],
             width=15, nrows=5, label="h = "),
      do_plot = ("Draw Plots", True)):
    try:
        f = SR(f); g = SR(g); a = SR(a)
    except TypeError, msg:
        print msg[-200:]
        print "Unable to make sense of f,g, or a as symbolic expressions."
        return
    if not (isinstance(xrange, tuple) and len(xrange) == 2):
          xrange = (0,1)
    h = 0; lbl = ''
    if action == 'f':
        h = f
        lbl = 'f'
    elif action == 'df/dx':
        h = f.derivative(x)
        lbl = '\\frac{df}{dx}'
    elif action == 'int f':
        h = f.integrate(x)
        lbl = '\\int f dx'
    elif action == 'num f':
        h = f.numerator()
        lbl = '\\text{numer(f)}'
    elif action == 'den f':
        h = f.denominator()
        lbl = '\\text{denom(f)}'
    elif action == '1/f':
        h = 1/f
        lbl = '\\frac{1}{f}'
    elif action == 'finv':
        h = solve(f == var('y'), x)[0].rhs()
        lbl = 'f^{-1}(y)'
    elif action == 'f+a':
        h = f+a
        lbl = 'f + a'
    elif action == 'f-a':
        h = f-a
        lbl = 'f - a'
    elif action == 'f*a':
        h = f*a
        lbl = 'f \\times a'
    elif action == 'f/a':
        h = f/a
        lbl = '\\frac{f}{a}'
    elif action == 'f^a':
        h = f^a
        lbl = 'f^a'
    elif action == 'f^a':
        h = f^a
        lbl = 'f^a'
    elif action == 'f(x+a)':
        h = f(x+a)
        lbl = 'f(x+a)'
    elif action == 'f(x*a)':
        h = f(x*a)
        lbl = 'f(xa)'
    elif action == 'f+g':
        h = f+g
        lbl = 'f + g'
    elif action == 'f-g':
        h = f-g
        lbl = 'f - g'
    elif action == 'f*g':
        h = f*g
        lbl = 'f \\times g'
    elif action == 'f/g':
        h = f/g
        lbl = '\\frac{f}{g}'
    elif action == 'f(g)':
        h = f(g)
        lbl = 'f(g)'
    html('<center><font color="red">$f = %s$</font></center>'%latex(f))
    html('<center><font color="green">$g = %s$</font></center>'%latex(g))
    html('<center><font color="blue"><b>$h = %s = %s$</b></font></center>'%(lbl, latex(h)))
    if do_plot:
        P = plot(f, xrange, color='red', thickness=2) +  \
            plot(g, xrange, color='green', thickness=2) + \
            plot(h, xrange, color='blue', thickness=2)
        if yrange == 'auto':
            show(P, xmin=xrange[0], xmax=xrange[1])
        else:
            yrange = sage_eval(yrange)
            show(P, xmin=xrange[0], xmax=xrange[1], ymin=yrange[0], ymax=yrange[1])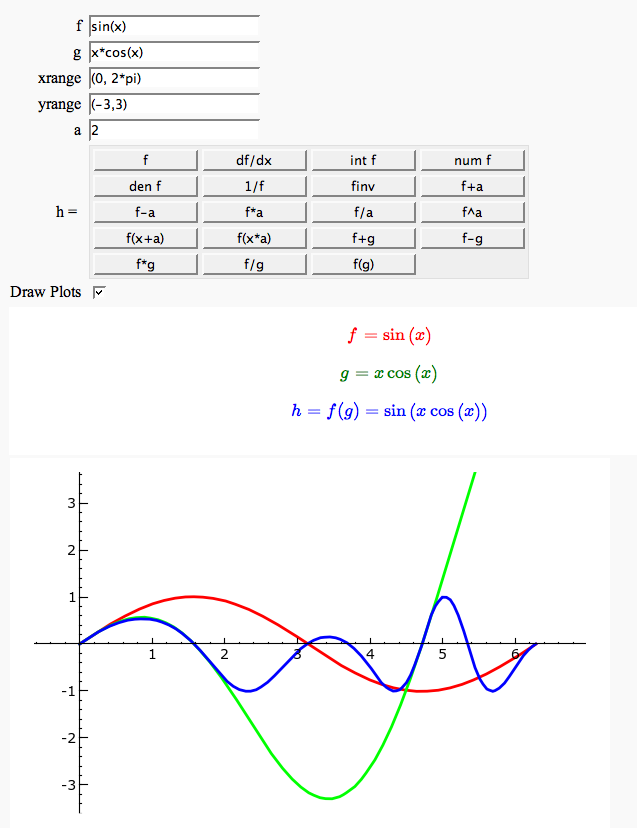
Newton-Raphson Root Finding
by Neal Holtz
This allows user to display the Newton-Raphson procedure one step at a time. It uses the heuristic that, if any of the values of the controls change, then the procedure should be re-started, else it should be continued.
# ideas from 'A simple tangent line grapher' by Marshall Hampton
# http://wiki.sagemath.org/interact

State = Data = None   # globals to allow incremental changes in interaction data

@interact
def newtraph(f = input_box(default=8*sin(x)*exp(-x)-1, label='f(x)'),
             xmin = input_box(default=0),
             xmax = input_box(default=4*pi),
             x0 = input_box(default=3, label='x0'),
             show_calcs = ("Show Calcs",True),
             step = ['Next','Prev', 'Reset'] ):
    global State, Data
    state = [f,xmin,xmax,x0,show_calcs]
    if (state != State) or (step == 'Reset'):   # when any of the controls change
        Data = [ 1 ]                            # reset the plot
        State = state
    elif step == 'Next':
        N, = Data
        Data = [ N+1 ]
    elif step == 'Prev':
        N, = Data
        if N > 1:
            Data = [ N-1 ]
    N, = Data
    df = diff(f)

    theplot = plot( f, xmin, xmax )
    theplot += text( '\n$x_0$', (x0,0), rgbcolor=(1,0,0),
                     vertical_alignment="bottom" if f(x0) < 0 else "top" )
    theplot += points( [(x0,0)], rgbcolor=(1,0,0) )

    Trace = []
    def Err( msg, Trace=Trace ):
        Trace.append( '<font color="red"><b>Error: %s!!</b></font>' % (msg,) )
    def Disp( s, color="blue", Trace=Trace ):
        Trace.append( """<font color="%s">$ %s $</font>""" % (color,s,) )

    Disp( """f(x) = %s""" % (latex(f),) )
    Disp( """f'(x) = %s""" % (latex(df),) )

    stop = False
    is_inf = False
    xi = x0
    for i in range(N):
        fi = RR(f(xi))
        fpi = RR(df(xi))

        theplot += points( [(xi,fi)], rgbcolor=(1,0,0) )
        theplot += line( [(xi,0),(xi,fi)], linestyle=':', rgbcolor=(1,0,0) ) # vert dotted line
        Disp( """i = %d""" % (i,) )
        Disp( """~~~~x_{%d} = %.4g""" % (i,xi) )
        Disp( """~~~~f(x_{%d}) = %.4g""" % (i,fi) )
        Disp( """~~~~f'(x_{%d}) = %.4g""" % (i,fpi) )

        if fpi == 0.0:
            Err( 'Derivative is 0 at iteration %d' % (i+1,) )
            is_inf = True
            show_calcs = True
        else:
            xip1 = xi - fi/fpi
            Disp( r"""~~~~x_{%d} = %.4g - ({%.4g})/({%.4g}) = %.4g""" % (i+1,xi,fi,fpi,xip1) )
            if abs(xip1) > 10*(xmax-xmin):
                Err( 'Derivative is too close to 0!' )
                is_inf = True
                show_calcs = True
            elif not ((xmin - 0.5*(xmax-xmin)) <= xip1 <= (xmax + 0.5*(xmax-xmin))):
                Err( 'x value out of range; probable divergence!' )
                stop = True
                show_calcs = True

        if is_inf:
            xl = xi - 0.05*(xmax-xmin)
            xr = xi + 0.05*(xmax-xmin)
            yl = yr = fi
        else:
            xl = min(xi,xip1) - 0.01*(xmax-xmin)
            xr = max(xi,xip1) + 0.01*(xmax-xmin)
            yl = -(xip1-xl)*fpi
            yr = (xr-xip1)*fpi
            theplot += text( '\n$x_{%d}$' % (i+1,), (xip1,0), rgbcolor=(1,0,0),
                             vertical_alignment="bottom" if f(xip1) < 0 else "top" )
            theplot += points( [(xip1,0)], rgbcolor=(1,0,0) )

        theplot += line( [(xl,yl),(xr,yr)], rgbcolor=(1,0,0) )  # tangent

        if stop or is_inf:
            break
        epsa = 100.0*abs((xip1-xi)/xip1)
        nsf = 2 - log(2.0*epsa)/log(10.0)
        Disp( r"""~~~~~~~~\epsilon_a = \left|(%.4g - %.4g)/%.4g\right|\times100\%% = %.4g \%%""" % (xip1,xi,xip1,epsa) )
        Disp( r"""~~~~~~~~num.~sig.~fig. \approx %.2g""" % (nsf,) )
        xi = xip1

    show( theplot, xmin=xmin, xmax=xmax )
    if show_calcs:
        for t in Trace:
            html( t )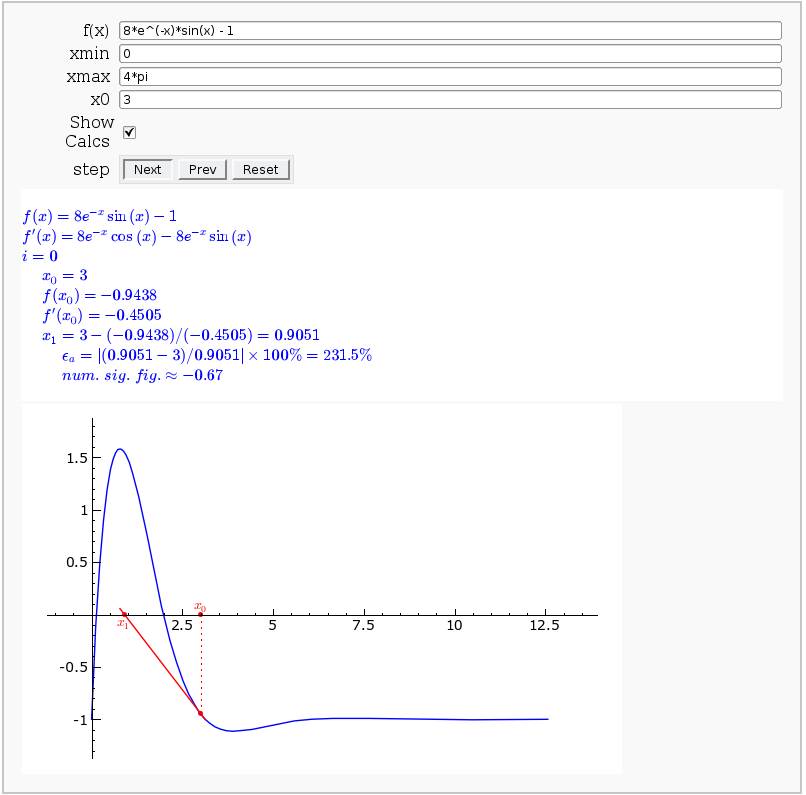
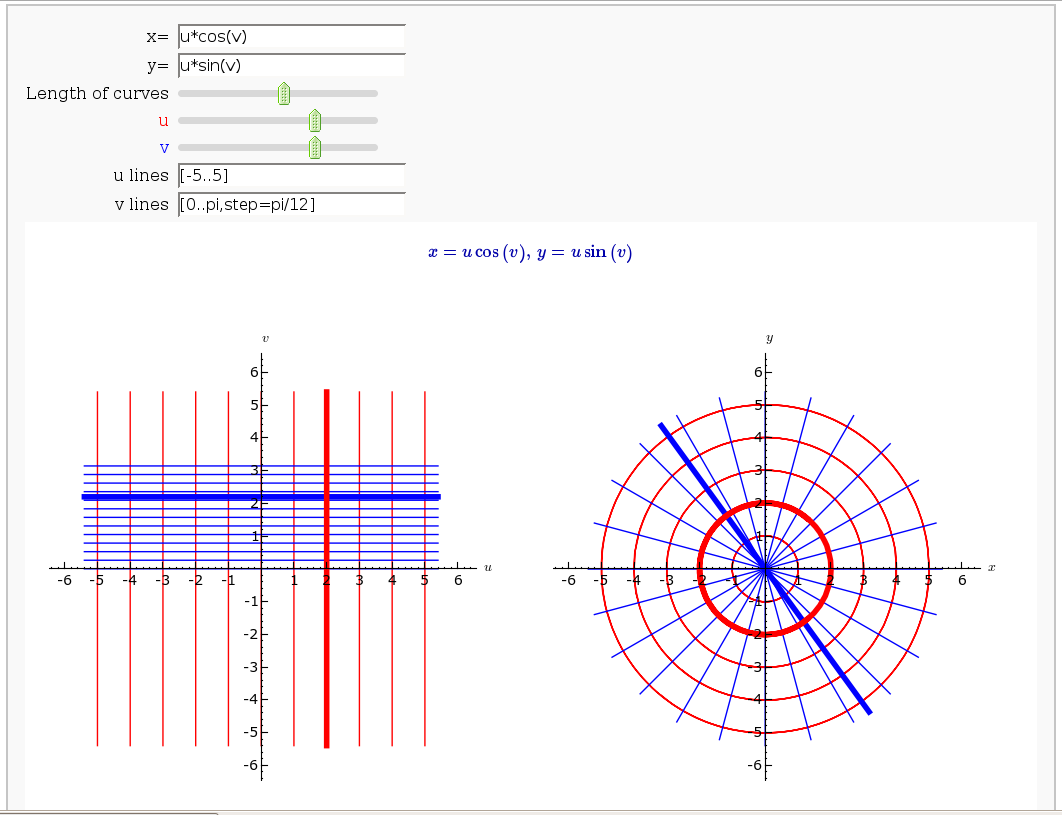
Coordinate Transformations
by Jason Grout
var('u v')
from sage.ext.fast_eval import fast_float
from functools import partial
@interact
def trans(x=input_box(u2-v2, label="x=",type=SR), \
         y=input_box(u*v+cos(u*v), label="y=",type=SR), \
         t_val=slider(0,10,0.2,6, label="Length of curves"), \
         u_percent=slider(0,1,0.05,label="<font color='red'>u</font>", default=.7),
         v_percent=slider(0,1,0.05,label="<font color='blue'>v</font>", default=.7),
         u_range=input_box(range(-5,5,1), label="u lines"),
         v_range=input_box(range(-5,5,1), label="v lines")):
     thickness=4
     u_val = min(u_range)+(max(u_range)-min(u_range))*u_percent
     v_val = min(v_range)+(max(v_range)-min(v_range))*v_percent
     t_min = -t_val
     t_max = t_val
     g1=sum([parametric_plot((i,v), t_min,t_max, rgbcolor=(1,0,0)) for i in u_range])
     g2=sum([parametric_plot((u,i), t_min,t_max, rgbcolor=(0,0,1)) for i in v_range])
     vline_straight=parametric_plot((u,v_val), t_min,t_max, rgbcolor=(0,0,1), linestyle='-',thickness=thickness)
     uline_straight=parametric_plot((u_val, v), t_min,t_max,rgbcolor=(1,0,0), linestyle='-',thickness=thickness)

    (g1+g2+vline_straight+uline_straight).save("uv_coord.png",aspect_ratio=1, figsize=[5,5], axes_labels=['$u$','$v$'])
     xuv = fast_float(x,'u','v')
     yuv = fast_float(y,'u','v')
     xvu = fast_float(x,'v','u')
     yvu = fast_float(y,'v','u')
     g3=sum([parametric_plot((partial(xuv,i),partial(yuv,i)), t_min,t_max, rgbcolor=(1,0,0)) for i in u_range])
     g4=sum([parametric_plot((partial(xvu,i),partial(yvu,i)), t_min,t_max, rgbcolor=(0,0,1)) for i in v_range])
     vline=parametric_plot((partial(xvu,v_val),partial(yvu,v_val)), t_min,t_max, rgbcolor=(0,0,1), linestyle='-',thickness=thickness)
     uline=parametric_plot((partial(xuv,u_val),partial(yuv,u_val)), t_min,t_max,rgbcolor=(1,0,0), linestyle='-',thickness=thickness)
     (g3+g4+vline+uline).save("xy_coord.png", aspect_ratio=1, figsize=[5,5], axes_labels=['$x$','$y$'])
     print jsmath("x=%s, \: y=%s"%(latex(x), latex(y)))
     print "<html><table><tr><td><img src='cell://uv_coord.png'/></td><td><img src='cell://xy_coord.png'/></td></tr></table></html>"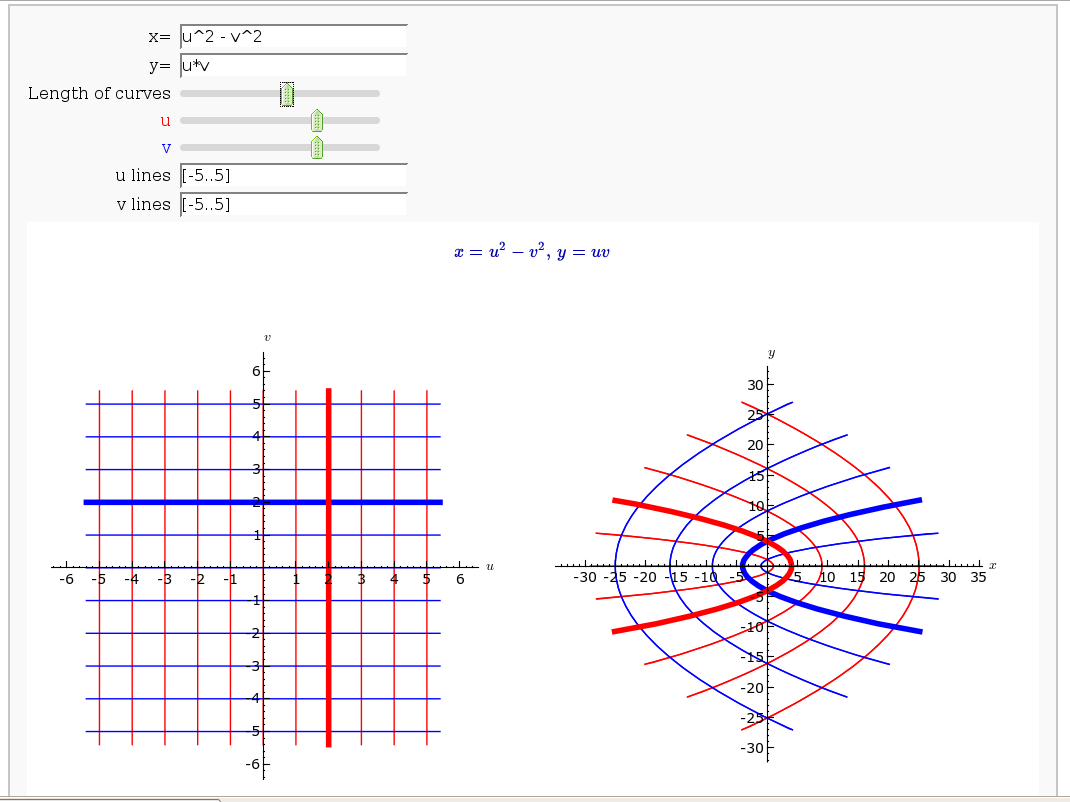
Taylor Series
by Harald Schilly
var('x')
x0  = 0
f   = sin(x)*e^(-x)
p   = plot(f,-1,5, thickness=2)
dot = point((x0,f(x0)),pointsize=80,rgbcolor=(1,0,0))
@interact
def _(order=(1..12)):
    ft = f.taylor(x,x0,order)
    pt = plot(ft,-1, 5, color='green', thickness=2)
    html('$f(x)\;=\;%s$'%latex(f))
    html('$\hat{f}(x;%s)\;=\;%s+\mathcal{O}(x^{%s})$'%(x0,latex(ft),order+1))
    show(dot + p + pt, ymin = -.5, ymax = 1)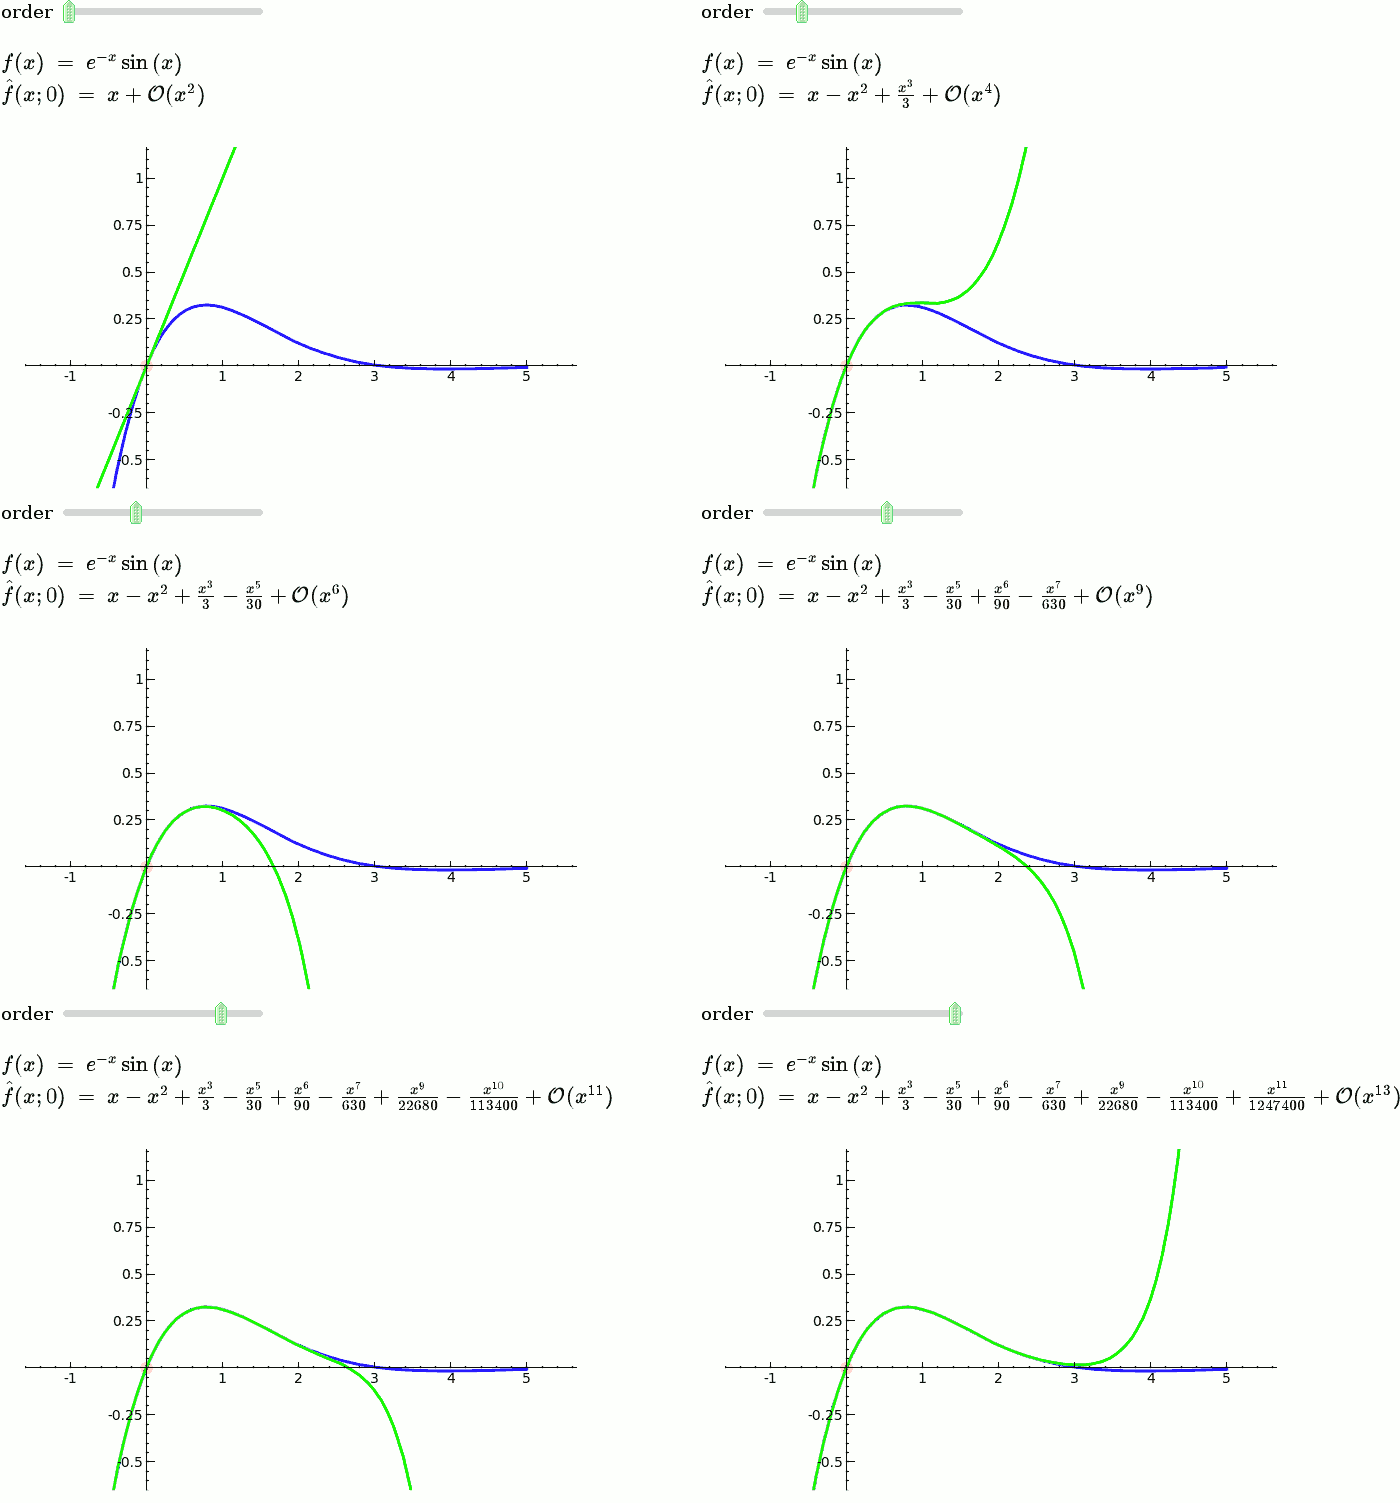
Illustration of the precise definition of a limit
by John Perry
I'll break tradition and put the image first. Apologies if this is Not A Good Thing.
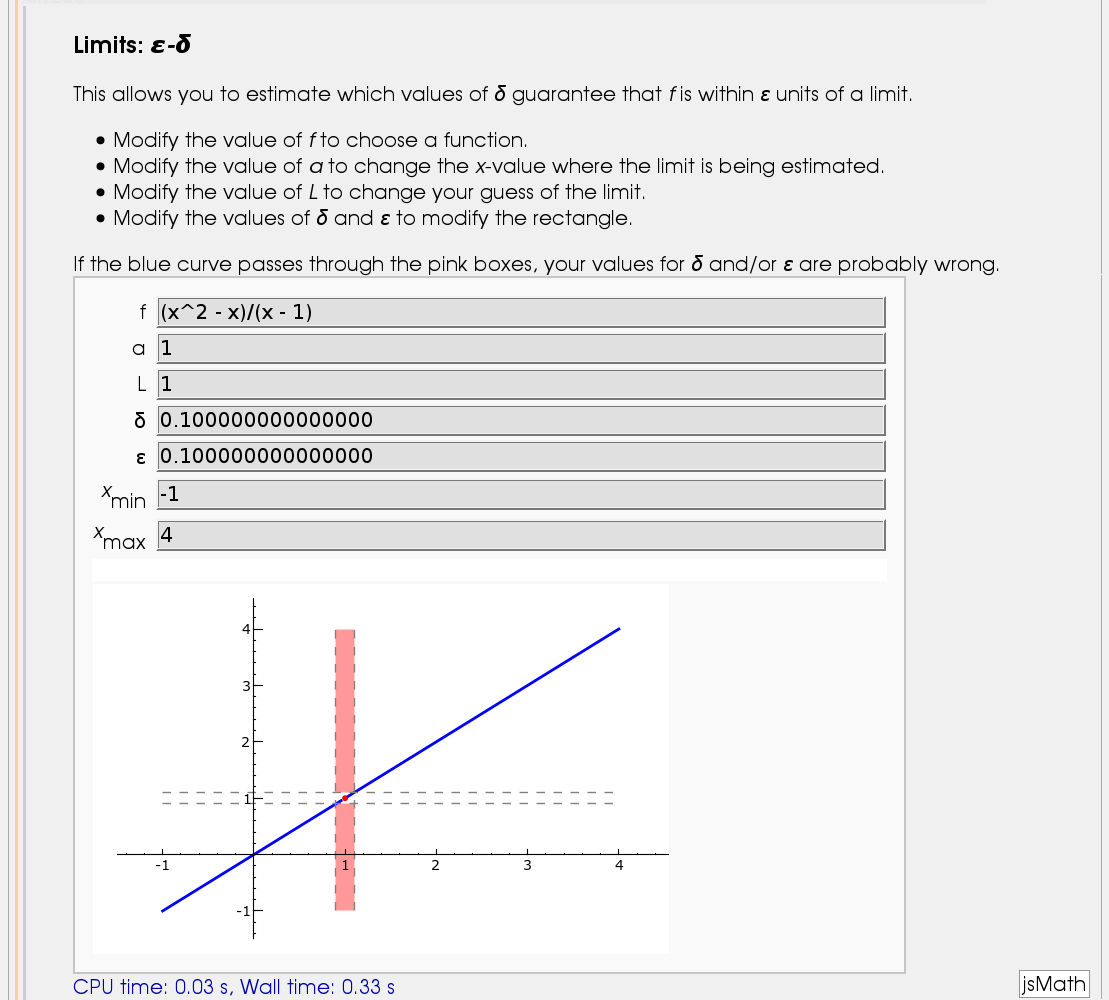
html("<h2>Limits: <i>ε-δ</i></h2>")
html("This allows you to estimate which values of <i>δ</i> guarantee that <i>f</i> is within <i>ε</i> units of a limit.")
html("<ul><li>Modify the value of <i>f</i> to choose a function.</li>")
html("<li>Modify the value of <i>a</i> to change the <i>x</i>-value where the limit is being estimated.</li>")
html("<li>Modify the value of <i>L</i> to change your guess of the limit.</li>")
html("<li>Modify the values of <i>δ</i> and <i>ε</i> to modify the rectangle.</li></ul>")
html("If the blue curve passes through the pink boxes, your values for <i>δ</i> and/or <i>ε</i> are probably wrong.")
@interact
def delta_epsilon(f = input_box(default=(x^2-x)/(x-1)), a=input_box(default=1), L = input_box(default=1), delta=input_box(label="δ",default=0.1), epsilon=input_box(label="ε",default=0.1), xm=input_box(label="<i>x</i><sub>min</sub>",default=-1), xM=input_box(label="<i>x</i><sub>max</sub>",default=4)):
    f_left_plot = plot(f,xm,a-delta/3,thickness=2)
    f_right_plot = plot(f,a+delta/3,xM,thickness=2)
    epsilon_line_1 = line([(xm,L-epsilon),(xM,L-epsilon)], rgbcolor=(0.5,0.5,0.5),linestyle='--')
    epsilon_line_2 = line([(xm,L+epsilon),(xM,L+epsilon)], rgbcolor=(0.5,0.5,0.5),linestyle='--')
    ym = min(f_right_plot.ymin(),f_left_plot.ymin())
    yM = max(f_right_plot.ymax(),f_left_plot.ymax())
    bad_region_1 = polygon([(a-delta,L+epsilon),(a-delta,yM),(a+delta,yM),(a+delta,L+epsilon)], rgbcolor=(1,0.6,0.6))
    bad_region_2 = polygon([(a-delta,L-epsilon),(a-delta,ym),(a+delta,ym),(a+delta,L-epsilon)], rgbcolor=(1,0.6,0.6))
    aL_point = point((a,L),rgbcolor=(1,0,0),pointsize=20)
    delta_line_1 = line([(a-delta,ym),(a-delta,yM)],rgbcolor=(0.5,0.5,0.5),linestyle='--')
    delta_line_2 = line([(a+delta,ym),(a+delta,yM)],rgbcolor=(0.5,0.5,0.5),linestyle='--')
    (f_left_plot +f_right_plot +epsilon_line_1 +epsilon_line_2 +delta_line_1 +delta_line_2 +aL_point +bad_region_1 +bad_region_2).show(xmin=xm,xmax=xM)
A graphical illustration of sin(x)/x -> 1 as x-> 0
by Wai Yan Pong
x=var('x')
@interact
def _(x = slider(-7/10,7/10,1/20,1/2)):
    html('<h3>A graphical illustration of $\lim_{x -> 0} \sin(x)/x =1$</h3>')
    html('Below is the unit circle, so the length of the <font color=red>red line</font> is |sin(x)|')
    html('and the length of the <font color=blue>blue line</font> is |tan(x)| where x is the length of the arc.')
    html('From the picture, we see that |sin(x)| $\le$ |x| $\le$ |tan(x)|.')
    html('It follows easily from this that cos(x) $\le$ sin(x)/x $\le$ 1 when x is near 0.')
    html('As $\lim_{x ->0} \cos(x) =1$, we conclude that $\lim_{x -> 0} \sin(x)/x =1$.')
    if not (x == 0):
        pretty_print("sin(x)/x = "+str(sin(float(x))/float(x)))
    elif x == 0:
        pretty_print("The limit of sin(x)/x as x tends to 0 is 1.")
    C=circle((0,0),1, rgbcolor='black')
    mvp = (cos(x),sin(x));tpt = (1, tan(x))
    p1 = point(mvp, pointsize=30, rgbcolor='red'); p2 = point((1,0), pointsize=30, rgbcolor='red')
    line1 = line([(0,0),tpt], rgbcolor='black'); line2 = line([(cos(x),0),mvp], rgbcolor='red')
    line3 = line([(0,0),(1,0)], rgbcolor='black'); line4 = line([(1,0),tpt], rgbcolor='blue')
    result = C+p1+p2+line1+line2+line3+line4
    result.show(aspect_ratio=1, figsize=[3,3], axes=False)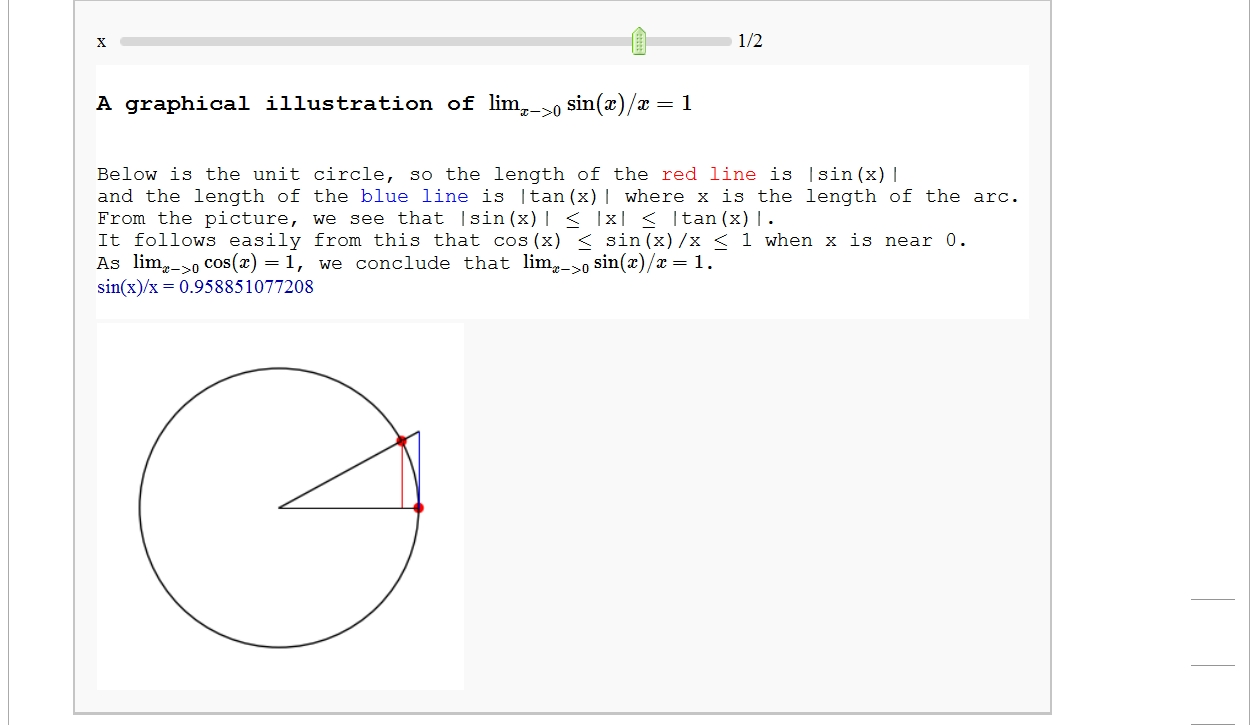
Quadric Surface Plotter
by Marshall Hampton. This is pretty simple, so I encourage people to spruce it up. In particular, it isn't set up to show all possible types of quadrics.
var('x,y,z')
quadrics = {'Ellipsoid':x^2+y^2+z^2-1,'Elliptic paraboloid':x^2+y^2-z,'Hyperbolic paraboloid':x^2-y^2-z, '1-Sheeted Hyperboloid':x^2+y^2-z^2-1,'2-Sheeted Hyperboloid':x^2-y^2-z^2-1, 'Cone':x^2+y^2-z^2}
@interact
def quads(q = selector(quadrics.keys()), a = slider(0,5,1/2,default = 1)):
    f = quadrics[q].subs({x:x*a^(1/2)})
    if a==0 or q=='Cone': html('<center>$'+latex(f)+' \ $'+ '(degenerate)</center>')
    else: html('<center>$'+latex(f)+'$ </center>')
    p = implicit_plot3d(f,(x,-2,2),(y,-2,2),(z,-2,2), plot_points = 75)
    show(p)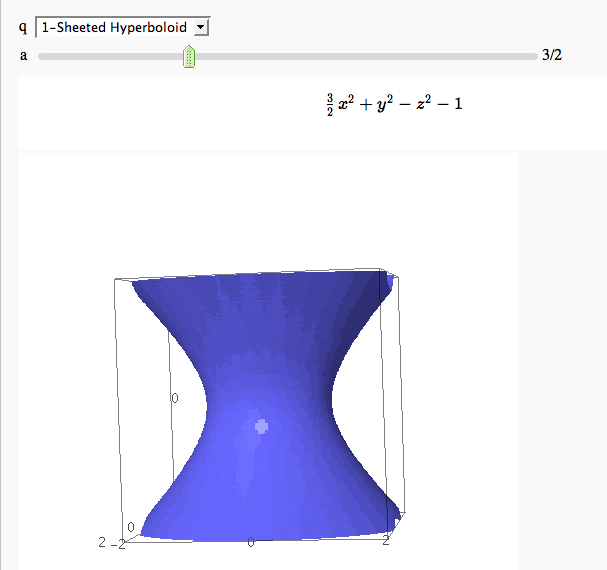
The midpoint rule for numerically integrating a function of two variables
by Marshall Hampton
from sage.plot.plot3d.platonic import index_face_set
def cuboid(v1,v2,**kwds):
    """
    Cuboid defined by corner points v1 and v2.
    """
    ptlist = []
    for vi in (v1,v2):
        for vj in (v1,v2):
            for vk in (v1,v2):
                ptlist.append([vi[0],vj[1],vk[2]])
    f_incs = [[0, 2, 6, 4], [0, 1, 3, 2], [0, 1, 5, 4], [1, 3, 7, 5], [2, 3, 7, 6], [4, 5, 7, 6]]

    if 'aspect_ratio' not in kwds:
        kwds['aspect_ratio'] = [1,1,1]
    return index_face_set(f_incs,ptlist,enclosed = True, **kwds)
var('x,y')
R16 = RealField(16)
npi = RDF(pi)
sin,cos = math.sin,math.cos
html("<h1>The midpoint rule for a function of two variables</h1>")
@interact
def midpoint2d(func = input_box('y*sin(x)/x+sin(y)',type=str,label='function of x and y'), nx = slider(2,20,1,3,label='x subdivisions'), ny = slider(2,20,1,3,label='y subdivisions'), x_start = slider(-10,10,.1,0), x_end = slider(-10,10,.1,3*npi), y_start= slider(-10,10,.1,0), y_end= slider(-10,10,.1,3*npi)):
    f = sage_eval('lambda x,y: ' + func)
    delx = (x_end - x_start)/nx
    dely = (y_end - y_start)/nx
    xvals = [RDF(x_start + (i+1.0/2)*delx) for i in range(nx)]
    yvals = [RDF(y_start + (i+1.0/2)*dely) for i in range(ny)]
    num_approx = 0
    cubs = []
    darea = delx*dely
    for xv in xvals:
        for yv in yvals:
            num_approx += f(xv,yv)*darea
            cubs.append(cuboid([xv-delx/2,yv-dely/2,0],[xv+delx/2,yv+dely/2,f(xv,yv)], opacity = .5, rgbcolor = (1,0,0)))
    html("$$\int_{"+str(R16(y_start))+"}^{"+str(R16(y_end))+"} "+ "\int_{"+str(R16(x_start))+"}^{"+str(R16(x_end))+"} "+func+"\ dx \ dy$$")
    html('<p style="text-align: center;">Numerical approximation: ' + str(num_approx)+'</p>')
    p1 = plot3d(f,(x,x_start,x_end),(y,y_start,y_end))
    show(p1+sum(cubs))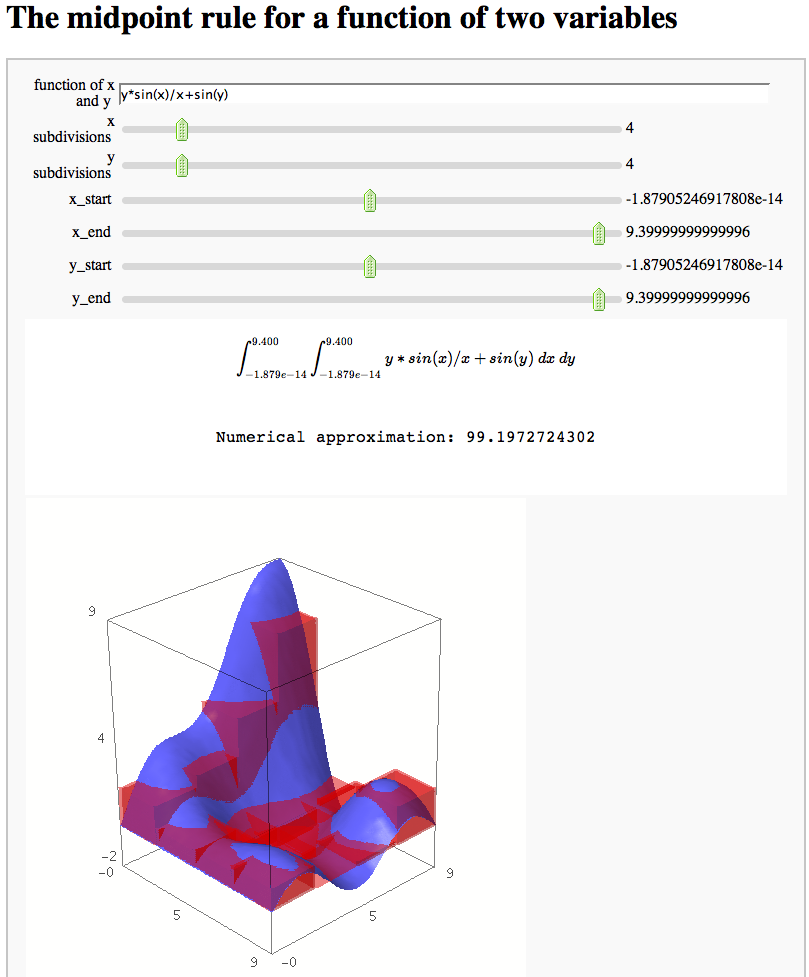
Gaussian (Legendre) quadrature
by Jason Grout
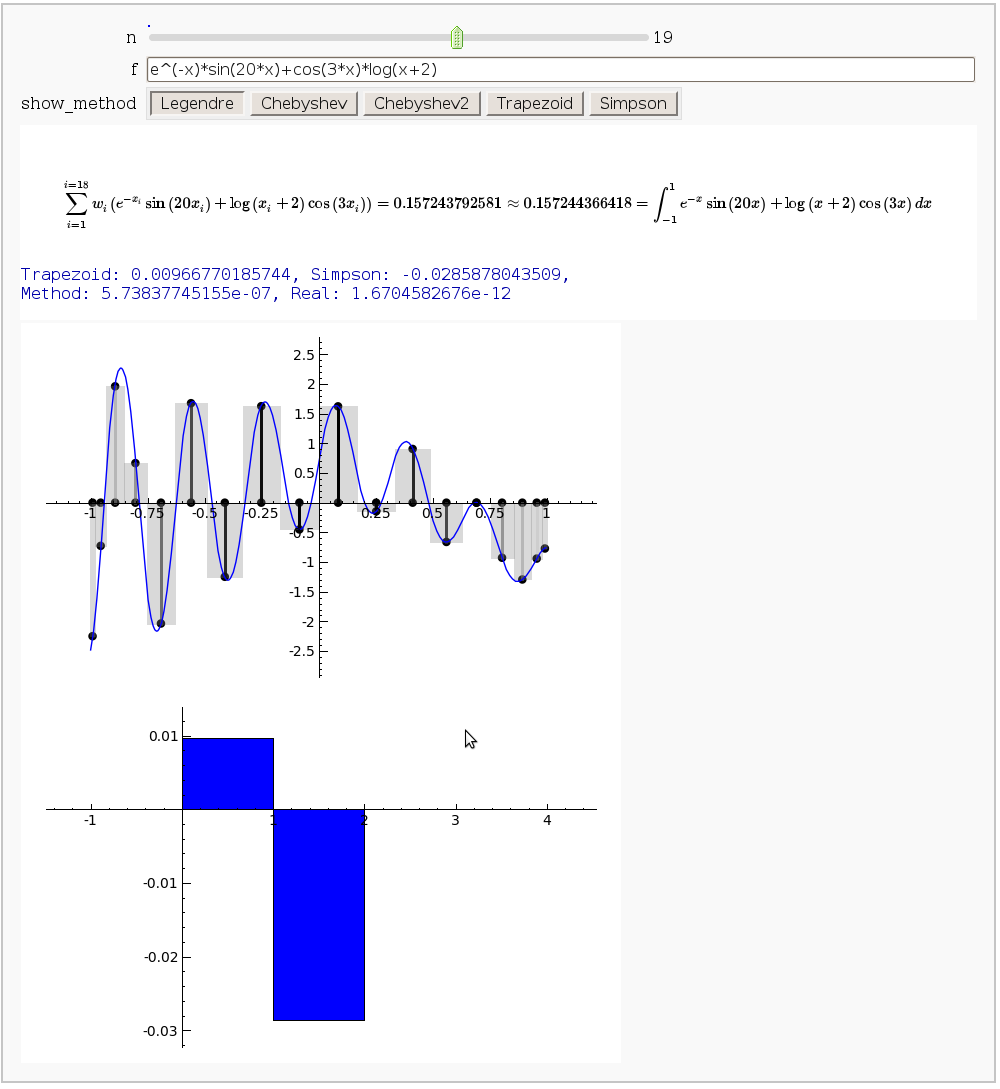
The output shows the points evaluated using Gaussian quadrature (using a weight of 1, so using Legendre polynomials). The vertical bars are shaded to represent the relative weights of the points (darker = more weight). The error in the trapezoid, Simpson, and quadrature methods is both printed out and compared through a bar graph. The "Real" error is the error returned from scipy on the definite integral.
from scipy.special.orthogonal import p_roots
from scipy.integrate import quad, trapz, simps
from sage.ext.fast_eval import fast_float
from numpy import linspace
show_weight_graph=False
#  'Hermite': {'w': e**(-x**2), 'xmin': -numpy.inf, 'xmax': numpy.inf, 'func': h_roots},
#  'Laguerre': {'w': e**(-x), 'xmin': 0, 'xmax': numpy.inf, 'func': l_roots},

methods = {'Legendre': {'w': 1, 'xmin': -1, 'xmax': 1, 'func': p_roots},
                'Chebyshev': {'w': 1/sqrt(1-x**2), 'xmin': -1, 'xmax': 1, 'func': t_roots},
                'Chebyshev2': {'w': sqrt(1-x**2), 'xmin': -1, 'xmax': 1, 'func': u_roots},
                'Trapezoid': {'w': 1, 'xmin': -1, 'xmax': 1, 'func': lambda n: (linspace(-1r,1,n), numpy.array([1.0r]+[2.0r]*(n-2)+[1.0r])*1.0r/n)},
                'Simpson': {'w': 1, 'xmin': -1, 'xmax': 1, 'func': lambda n: (linspace(-1r,1,n), numpy.array([1.0r]+[4.0r,2.0r]*int((n-3.0r)/2.0r)+[4.0r,1.0r])*2.0r/(3.0r*n))}}
var("x")
def box(center, height, area,**kwds):
    width2 = 1.0*area/height/2.0
    return polygon([(center-width2,0),(center+width2,0),(center+width2,height),(center-width2,height)],**kwds)


@interact
def weights(n=slider(1,30,1,default=10),f=input_box(default=3*x+cos(10*x)),show_method=["Legendre", "Chebyshev", "Chebyshev2", "Trapezoid","Simpson"]):
    ff = fast_float(f,'x')
    method = methods[show_method]
    xcoords,w = (method['func'])(int(n))
    xmin = method['xmin']
    xmax = method['xmax']
    plot_min = max(xmin, -10)
    plot_max = min(xmax, 10)
    scaled_func = f*method['w']
    scaled_ff = fast_float(scaled_func)

    coords = zip(xcoords,w)
    max_weight = max(w)
    coords_scaled = zip(xcoords,w/max_weight)

    f_graph = plot(scaled_func,plot_min,plot_max)
    boxes = sum(box(x,ff(x),w*ff(x),rgbcolor=(0.5,0.5,0.5),alpha=0.3) for x,w in coords)
    stems = sum(line([(x,0),(x,scaled_ff(x))],rgbcolor=(1-y,1-y,1-y),thickness=2,markersize=6,alpha=y) for x,y in coords_scaled)
    points = sum([point([(x,0),(x,scaled_ff(x))],rgbcolor='black',pointsize=30) for x,_ in coords])
    graph = stems+points+f_graph+boxes
    if show_weight_graph:
        graph += line([(x,y) for x,y in coords_scaled], rgbcolor='green',alpha=0.4)

    show(graph,xmin=plot_min,xmax=plot_max)

    approximation = sum([w*ff(x) for x,w in coords])
    integral,integral_error = scipy.integrate.quad(scaled_ff, xmin, xmax)
    x_val = linspace(min(xcoords), max(xcoords),n)
    y_val = map(scaled_ff,x_val)
    trapezoid = integral-trapz(y_val, x_val)
    simpson = integral-simps(y_val, x_val)
    html("$$\sum_{i=1}^{i=%s}w_i\left(%s\\right)= %s\\approx %s =\int_{-1}^{1}%s \,dx$$"%(n,latex(f.subs(x="x_i")), approximation, integral, latex(scaled_func)))
    error_data = [trapezoid, simpson, integral-approximation,integral_error]
    print "Trapezoid: %s, Simpson: %s, \nMethod: %s, Real: %s"%tuple(error_data)
    show(bar_chart(error_data,width=1),ymin=min(error_data), ymax=max(error_data))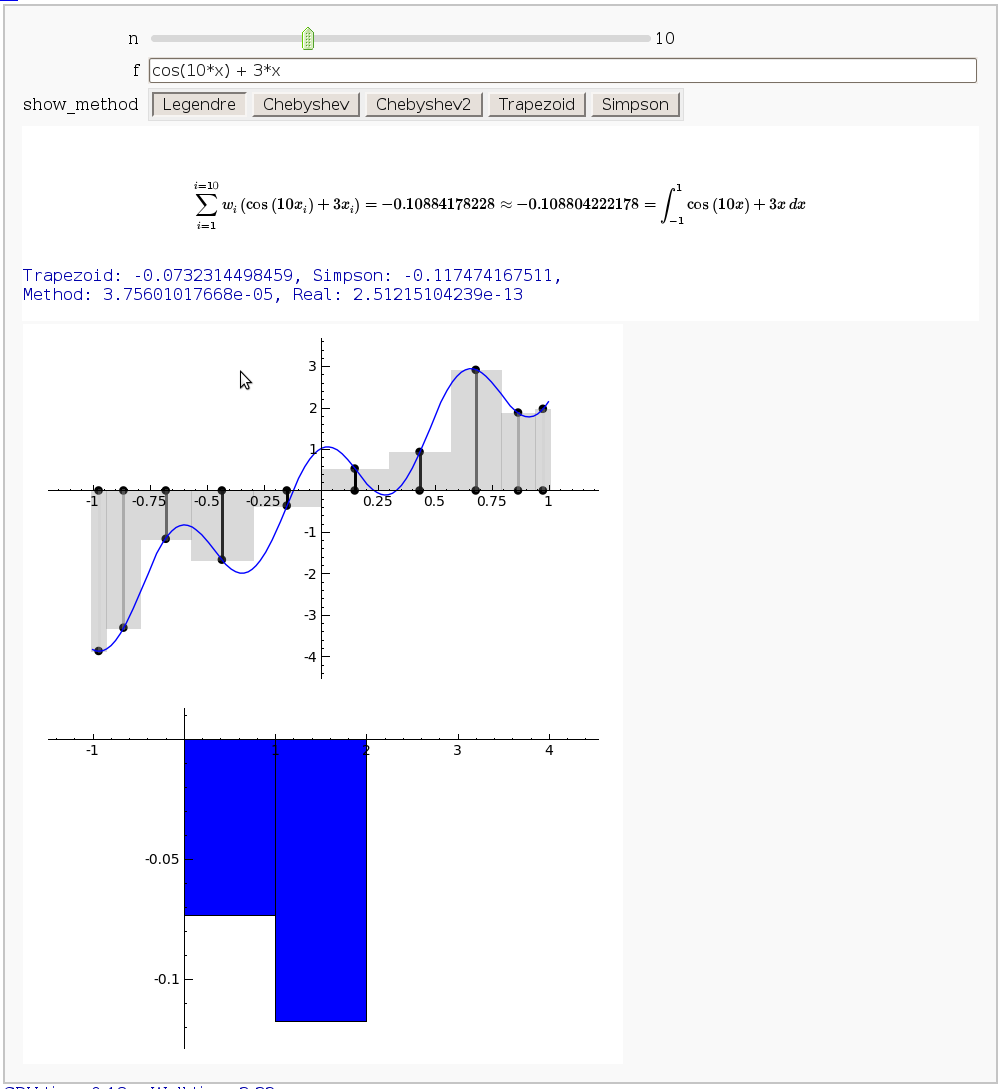
Vector Calculus, 2-D Motion
By Rob Beezer
A fast_float() version is available in a worksheet
# 2-D motion and vector calculus
# Copyright 2009, Robert A. Beezer
# Creative Commons BY-SA 3.0 US
#
# 2009/02/15  Built on Sage 3.3.rc0
# 2009/02/17  Improvements from Jason Grout
#
# variable parameter is  t
# later at a particular value named t0
#
var('t')
#
# parameter range
#
start=0
stop=2*pi
#
# position vector definition
# edit here for new example
# example is wide ellipse
# adjust x, extents in final show()
#
position=vector( (4*cos(t), sin(t)) )
#
# graphic of the motion itself
#
path = parametric_plot( position(t).list(), (t, start, stop), color = "black" )
#
# derivatives of motion, lengths, unit vectors, etc
#
velocity = derivative( position(t) )
acceleration = derivative(velocity(t))
speed = velocity.norm()
speed_deriv = derivative(speed)
tangent = (1/speed)*velocity
dT = derivative(tangent(t))
normal = (1/dT.norm())*dT
#
# interact section
#   slider for parameter, 24 settings
#   checkboxes for various vector displays
#   computations at one value of parameter, t0
#
@interact
def _(t0 = slider(float(start), float(stop), float((stop-start)/24), float(start) , label = "Parameter"),
      pos_check = ("Position", True),
      vel_check = ("Velocity", False),
      tan_check = ("Unit Tangent", False),
      nor_check = ("Unit Normal", False),
      acc_check = ("Acceleration", False),
      tancomp_check = ("Tangential Component", False),
      norcomp_check = ("Normal Component", False)
       ):
    #
    # location of interest
    #
    pos_tzero = position(t0)
    #
    # various scalar quantities at point
    #
    speed_component = speed(t0)
    tangent_component = speed_deriv(t0)
    normal_component = sqrt( acceleration(t0).norm()^2 - tangent_component^2 )
    curvature = normal_component/speed_component^2
    #
    # various vectors, mostly as arrows from the point
    #
    pos = arrow((0,0), pos_tzero, rgbcolor=(0,0,0))
    tan = arrow(pos_tzero, pos_tzero + tangent(t0), rgbcolor=(0,1,0) )
    vel = arrow(pos_tzero, pos_tzero + velocity(t0), rgbcolor=(0,0.5,0))
    nor = arrow(pos_tzero, pos_tzero + normal(t0), rgbcolor=(0.5,0,0))
    acc = arrow(pos_tzero, pos_tzero + acceleration(t0), rgbcolor=(1,0,1))
    tancomp = arrow(pos_tzero, pos_tzero + tangent_component*tangent(t0), rgbcolor=(1,0,1) )
    norcomp = arrow(pos_tzero, pos_tzero + normal_component*normal(t0), rgbcolor=(1,0,1))
    #
    # accumulate the graphic based on checkboxes
    #
    picture = path
    if pos_check:
        picture = picture + pos
    if vel_check:
        picture = picture + vel
    if tan_check:
        picture = picture+ tan
    if nor_check:
        picture = picture + nor
    if acc_check:
        picture = picture + acc
    if tancomp_check:
        picture = picture + tancomp
    if norcomp_check:
        picture = picture + norcomp
    #
    # print textual info
    #
    print "Position vector defined as r(t)=", position(t)
    print "Speed is ", N(speed(t0))
    print "Curvature is ", N(curvature)
    #
    # show accumulated graphical info
    # adjust x-,y- extents to get best plot
    #
    show(picture, xmin=-4,xmax=4, ymin=-1.5,ymax=1.5,aspect_ratio=1)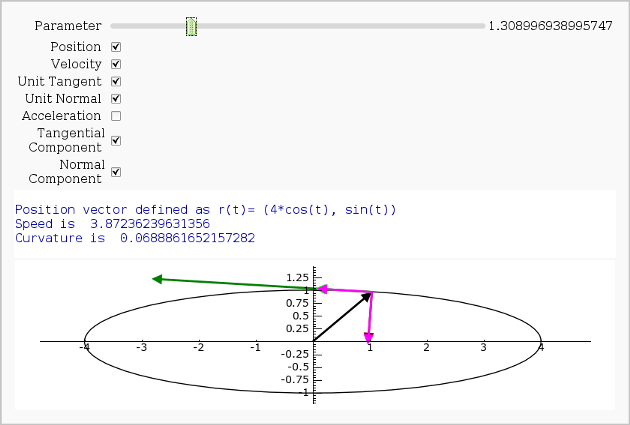
Vector Calculus, 3-D Motion
by Rob Beezer
Available as a worksheet
# 3-D motion and vector calculus
# Copyright 2009, Robert A. Beezer
# Creative Commons BY-SA 3.0 US
#
#
# 2009/02/15  Built on Sage 3.3.rc0
# 2009/02/17  Improvements from Jason Grout
#
# variable parameter is  t
# later at a particular value named t0
#
# un-comment double hash (##) to get
# time-consuming torsion computation
#
var('t')
#
# parameter range
#
start=-4*pi
stop=8*pi
#
# position vector definition
# edit here for new example
# example is wide ellipse
# adjust figsize in final show() to get accurate aspect ratio
#
a=1/(8*pi)
c=(3/2)*a
position=vector( (exp(a*t)*cos(t), exp(a*t)*sin(t), exp(c*t)) )
#
# graphic of the motion itself
#
path = parametric_plot3d( position(t).list(), (t, start, stop), color = "black" )
#
# derivatives of motion, lengths, unit vectors, etc
#
velocity = derivative( position(t) )
acceleration = derivative(velocity(t))
speed = velocity.norm()
speed_deriv = derivative(speed)
tangent = (1/speed)*velocity
dT = derivative(tangent(t))
normal = (1/dT.norm())*dT
binormal = tangent.cross_product(normal)
## dB = derivative(binormal(t))
#
# interact section
#   slider for parameter, 24 settings
#   checkboxes for various vector displays
#   computations at one value of parameter, t0
#
@interact
def _(t0 = slider(float(start), float(stop), float((stop-start)/24), float(start) , label = "Parameter"),
      pos_check = ("Position", True),
      vel_check = ("Velocity", False),
      tan_check = ("Unit Tangent", False),
      nor_check = ("Unit Normal", False),
      bin_check = ("Unit Binormal", False),
      acc_check = ("Acceleration", False),
      tancomp_check = ("Tangential Component", False),
      norcomp_check = ("Normal Component", False)
       ):
    #
    # location of interest
    #
    pos_tzero = position(t0)
    #
    # various scalar quantities at point
    #
    speed_component = speed(t0)
    tangent_component = speed_deriv(t0)
    normal_component = sqrt( acceleration(t0).norm()^2 - tangent_component^2 )
    curvature = normal_component/speed_component^2
    ## torsion = (1/speed_component)*(dB(t0)).dot_product(normal(t0))
    #
    # various vectors, mostly as arrows from the point
    #
    pos = arrow3d((0,0,0), pos_tzero, rgbcolor=(0,0,0))
    tan = arrow3d(pos_tzero, pos_tzero + tangent(t0), rgbcolor=(0,1,0) )
    vel = arrow3d(pos_tzero, pos_tzero + velocity(t0), rgbcolor=(0,0.5,0))
    nor = arrow3d(pos_tzero, pos_tzero + normal(t0), rgbcolor=(0.5,0,0))
    bin = arrow3d(pos_tzero, pos_tzero + binormal(t0), rgbcolor=(0,0,0.5))
    acc = arrow3d(pos_tzero, pos_tzero + acceleration(t0), rgbcolor=(1,0,1))
    tancomp = arrow3d(pos_tzero, pos_tzero + tangent_component*tangent(t0), rgbcolor=(1,0,1) )
    norcomp = arrow3d(pos_tzero, pos_tzero + normal_component*normal(t0), rgbcolor=(1,0,1))
    #
    # accumulate the graphic based on checkboxes
    #
    picture = path
    if pos_check:
        picture = picture + pos
    if vel_check:
        picture = picture + vel
    if tan_check:
        picture = picture+ tan
    if nor_check:
        picture = picture + nor
    if bin_check:
        picture = picture + bin
    if acc_check:
        picture = picture + acc
    if tancomp_check:
        picture = picture + tancomp
    if norcomp_check:
        picture = picture + norcomp
    #
    # print textual info
    #
    print "Position vector: r(t)=", position(t)
    print "Speed is ", N(speed(t0))
    print "Curvature is ", N(curvature)
    ## print "Torsion is ", N(torsion)
    print
    print "Right-click on graphic to zoom to 400%"
    print "Drag graphic to rotate"
    #
    # show accumulated graphical info
    #
    show(picture, aspect_ratio=[1,1,1])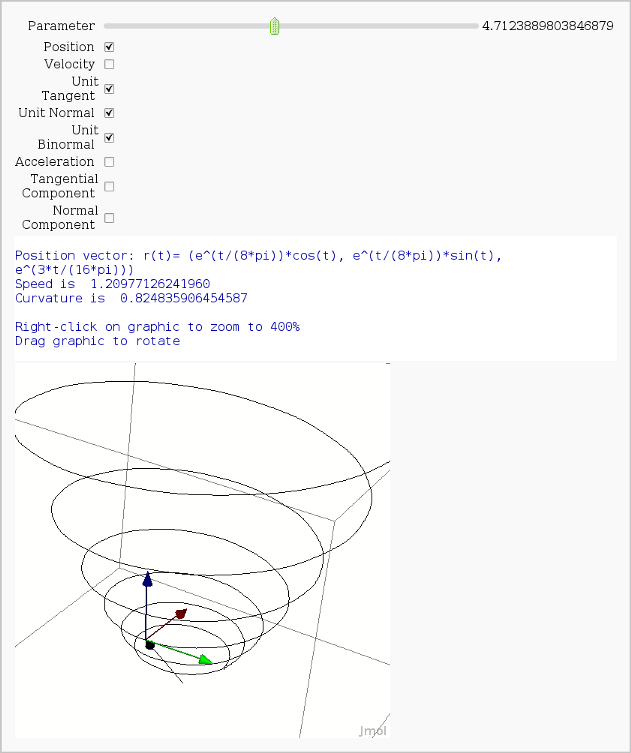
Directional Derivatives
This interact displays graphically a tangent line to a function, illustrating a directional derivative (the slope of the tangent line).
var('x,y,t,z')
f(x,y)=sin(x)*cos(y)

pif = float(pi)

line_thickness=3
surface_color='blue'
plane_color='purple'
line_color='red'
tangent_color='green'
gradient_color='orange'

@interact
def myfun(location=input_grid(1, 2, default=[0,0], label = "Location (x,y)", width=2), angle=slider(0, 2*pif, label = "Angle"),
show_surface=("Show surface", True)):
    location3d = vector(location[0]+[0])
    location = location3d[0:2]
    direction3d = vector(RDF, [cos(angle), sin(angle), 0])
    direction=direction3d[0:2]
    cos_angle = math.cos(angle)
    sin_angle = math.sin(angle)
    df = f.gradient()
    direction_vector=line3d([location3d, location3d+direction3d], arrow_head=True, rgbcolor=line_color, thickness=line_thickness)
    curve_point = (location+t*direction).list()
    curve = parametric_plot(curve_point+[f(*curve_point)], (t,-3,3),color=line_color,thickness=line_thickness)
    plane = parametric_plot((cos_angle*x+location[0],sin_angle*x+location[1],t), (x, -3,3), (t,-3,3),opacity=0.8, color=plane_color)
    pt = point3d(location3d.list(),color='green', size=10)

    tangent_line = parametric_plot((location[0]+t*cos_angle, location[1]+t*sin_angle, f(*location)+t*df(*location)*(direction)), (t, -3,3), thickness=line_thickness, color=tangent_color)
    picture3d = direction_vector+curve+plane+pt+tangent_line

    picture2d = contour_plot(f(x,y), (x,-3,3),(y,-3,3), plot_points=100)
    picture2d += arrow(location.list(), (location+direction).list())
    picture2d += point(location.list(),rgbcolor='green',pointsize=40)
    if show_surface:
        picture3d += plot3d(f, (x,-3,3),(y,-3,3),opacity=0.7)

    dff = df(location[0], location[1])
    dff3d = vector(RDF,dff.list()+[0])
    picture3d += line3d([location3d, location3d+dff3d], arrow_head=True, rgbcolor=gradient_color, thickness=line_thickness)
    picture2d += arrow(location.list(), (location+dff).list(), rgbcolor=gradient_color, width=line_thickness)
    show(picture3d,aspect=[1,1,1], axes=True)
    show(picture2d, aspect_ratio=1)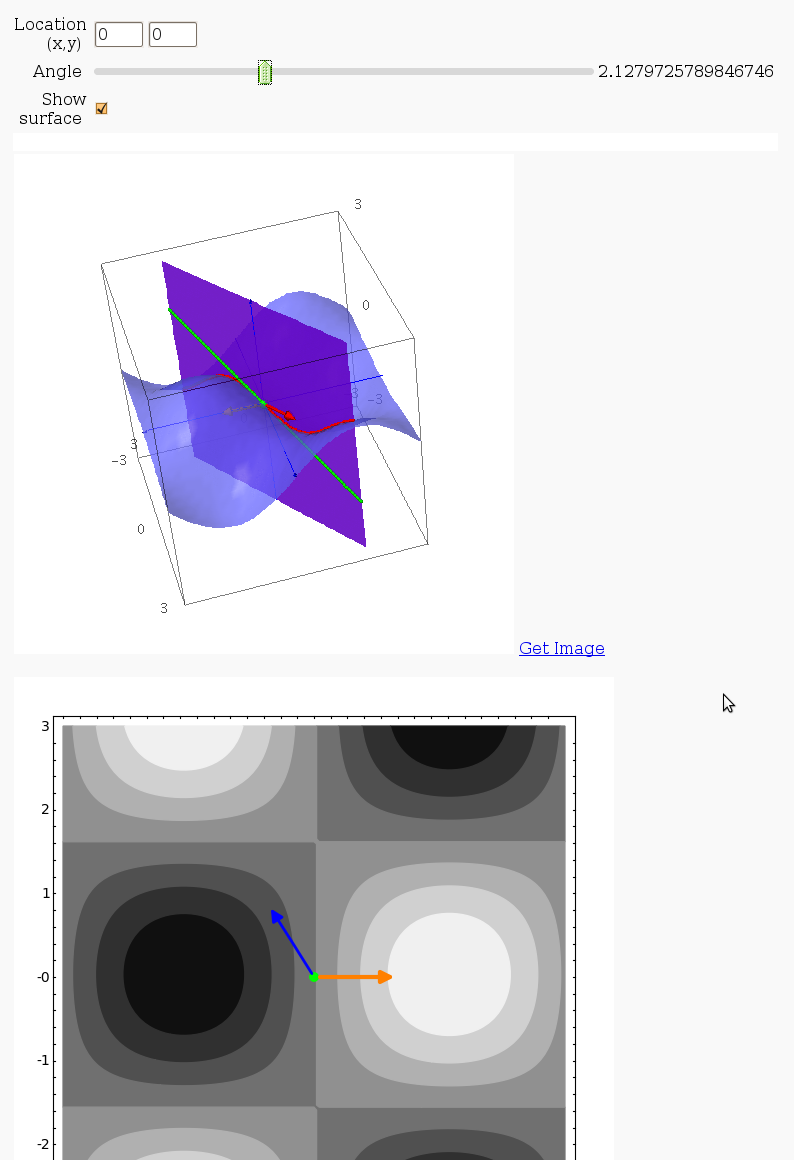
3D graph with points and curves
By Robert Marik
This sagelet is handy when showing local, constrained and absolute maxima and minima in two variables. Available as a worksheet
%hide
%auto
x,y, t, u, v =var('x y t u v')
INI_func='x^2-2*x+y^2-2*y'
INI_box='-1,3.2,-1,3.2'
INI_points='(1,1,\'green\'),(3/2,3/2),(0,1),(1,0),(0,0,\'black\'),(3,0,\'black\'),(0,3,\'black\')'
INI_curves='(t,0,0,3,\'red\'),(0,t,0,3,\'green\'),(t,3-t,0,3)'
@interact
def _(func=input_box(INI_func,label="f(x,y)=",type=str),\
  bounds=input_box(INI_box,label="xmin,xmax,ymin,ymax",type=str),\
  st_points=input_box(INI_points,\
  label="points <br><small><small>(comma separated pairs, optionally with color)</small></small>", type=str),\
  bnd_curves=input_box(INI_curves,label="curves on boundary<br> <small><small><i>(x(t),y(t),tmin,tmax,'opt_color')</i></small></small>", type=str),\
 show_planes=("Show zero planes", False),  show_axes=("Show axes", True),
 show_table=("Show table", True)):
 f=sage_eval('lambda x,y: ' + func)
 html(r'Function $ f(x,y)=%s$ '%latex(f(x,y)))
 xmin,xmax,ymin,ymax=sage_eval('('+bounds+')')
 A=plot3d(f(x,y),(x,xmin,xmax),(y,ymin,ymax),opacity=0.5)
 if not(bool(st_points=='')):
     st_p=sage_eval('('+st_points+',)')
     html(r'<table border=1>')
     for current in range(len(st_p)):
         point_color='red'
         if bool(len(st_p[current])==3):
              point_color=st_p[current][2]
         x0=st_p[current][0]
         y0=st_p[current][1]
         z0=f(x0,y0)
         if show_table:
              html(r'<tr><td>$\quad f(%s,%s)\quad $</td><td>$\quad %s$</td>\
              </tr>'%(latex(x0),latex(y0),z0.n()))
         A=A+point3d((x0,y0,z0),size=9,rgbcolor=point_color)
     html(r'</table>')
 if not(bool(bnd_curves=='')):
     bnd_cc=sage_eval('('+bnd_curves+',)',locals={'t':t})
     for current in range(len(bnd_cc)):
         bnd_c=bnd_cc[current]+('black',)
         A=A+parametric_plot3d((bnd_c[0],bnd_c[1],f(bnd_c[0],bnd_c[1])),\
             (t,bnd_c[2],bnd_c[3]),thickness=3,rgbcolor=bnd_c[4])
 if show_planes:
     A=A+plot3d(0,(x,xmin,xmax),(y,ymin,ymax),opacity=0.3,rgbcolor='gray')
     zmax=A.bounding_box()[1][2]
     zmin=A.bounding_box()[0][2]
     A=A+parametric_plot3d((u,0,v),(u,xmin,xmax),(v,zmin,zmax),opacity=0.3,rgbcolor='gray')
     A=A+parametric_plot3d((0,u,v),(u,ymin,ymax),(v,zmin,zmax),opacity=0.3,rgbcolor='gray')
 if show_axes:
     zmax=A.bounding_box()[1][2]
     zmin=A.bounding_box()[0][2]
     A=A+line3d([(xmin,0,0), (xmax,0,0)], arrow_head=True,rgbcolor='black')
     A=A+line3d([(0,ymin,0), (0,ymax,0)], arrow_head=True,rgbcolor='black')
     A=A+line3d([(0,0,zmin), (0,0,zmax)], arrow_head=True,rgbcolor='black')
 show(A)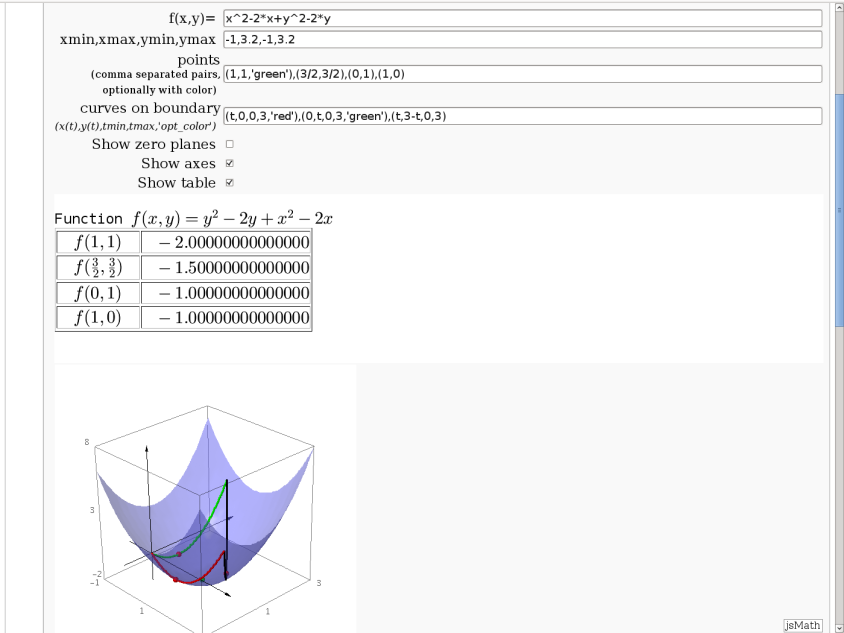
Approximating function in two variables by differential
by Robert Marik
x,y=var('x y')
html('<h2>Explaining approximation of a function in two \
variables by differential</h2>')
html('Points x0 and y0 are values where the exact value of the function \
is known. Deltax and Deltay are displacements of the new point. Exact value \
and approximation by differential at shifted point are compared.')
@interact
def _(func=input_box('sqrt(x^3+y^3)',label="f(x,y)=",type=str), x0=1, y0=2, \
  deltax=slider(-1,1,0.01,0.2),\
  deltay=slider(-1,1,0.01,-0.4), xmin=0, xmax=2, ymin=0, ymax=3):
  f=sage_eval('lambda x,y: ' + func)
  derx(x,y)=diff(f(x,y),x)
  dery(x,y)=diff(f(x,y),y)
  tangent(x,y)=f(x0,y0)+derx(x0,y0)*(x-x0)+dery(x0,y0)*(y-y0)
  A=plot3d(f(x,y),(x,xmin,xmax),(y,ymin,ymax),opacity=0.5)
  B=plot3d(tangent(x,y),(x,xmin,xmax),(y,ymin,ymax),color='red',opacity=0.5)
  C=point3d((x0,y0,f(x0,y0)),rgbcolor='blue',size=9)
  CC=point3d((x0+deltax,y0+deltay,f(x0+deltax,y0+deltay)),rgbcolor='blue',size=9)
  D=point3d((x0+deltax,y0+deltay,tangent(x0+deltax,y0+deltay)),rgbcolor='red',size=9)
  exact_value_ori=f(x0,y0).n(digits=10)
  exact_value=f(x0+deltax,y0+deltay)
  approx_value=tangent(x0+deltax,y0+deltay).n(digits=10)
  abs_error=(abs(exact_value-approx_value))
  html(r'Function $ f(x,y)=%s \approx %s $ '%(latex(f(x,y)),latex(tangent(x,y))))
  html(r' $f %s = %s$'%(latex((x0,y0)),latex(exact_value_ori)))
  html(r'Shifted point $%s$'%latex(((x0+deltax),(y0+deltay))))
  html(r'Value of the function in shifted point is $%s$'%f(x0+deltax,y0+deltay))
  html(r'Value on the tangent plane in shifted point is $%s$'%latex(approx_value))
  html(r'Error is $%s$'%latex(abs_error))
  show(A+B+C+CC+D)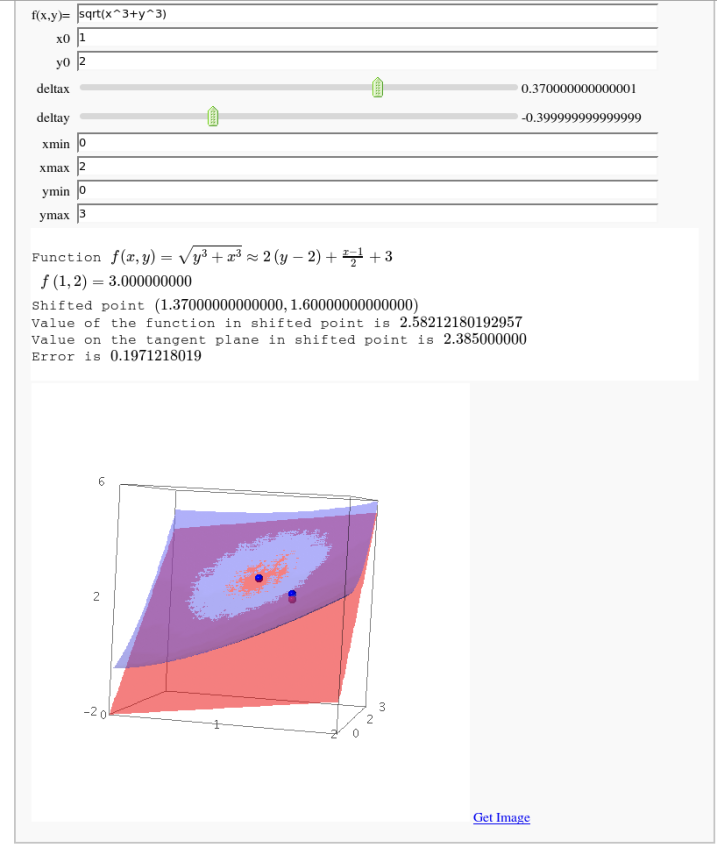
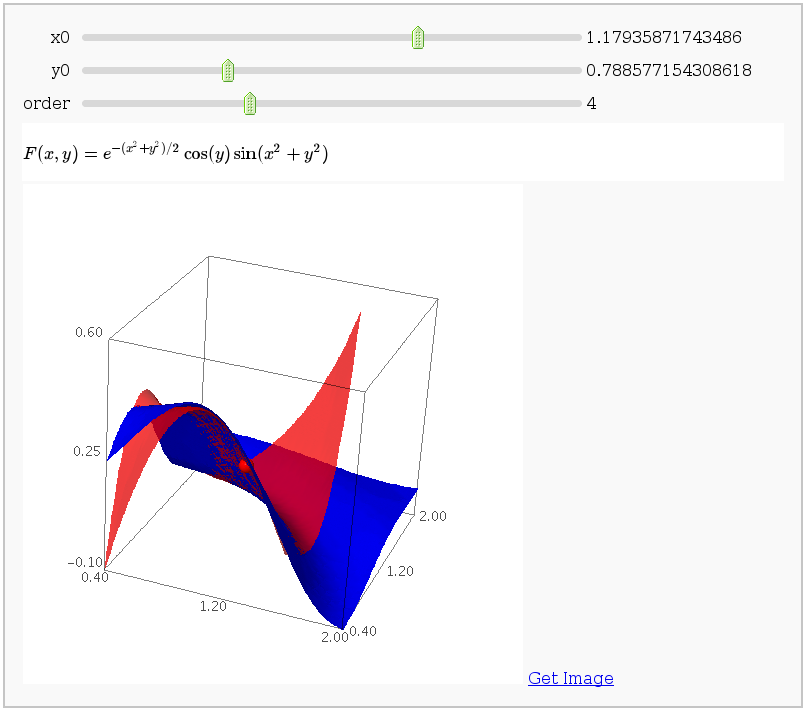
Taylor approximations in two variables
by John Palmieri
This displays the nth order Taylor approximation, for n from 1 to 10, of the function sin(x2 + y2) cos(y) exp(-(x2+y2)/2).
var('x y')
var('xx yy')
G = sin(xx^2 + yy^2) * cos(yy) * exp(-0.5*(xx^2+yy^2))
def F(x,y):
    return G.subs(xx=x).subs(yy=y)
plotF = plot3d(F, (0.4, 2), (0.4, 2), adaptive=True, color='blue')
@interact
def _(x0=(0.5,1.5), y0=(0.5, 1.5),
      order=(1..10)):
    F0 = float(G.subs(xx=x0).subs(yy=y0))
    P = (x0, y0, F0)
    dot = point3d(P, size=15, color='red')
    plot = dot + plotF
    approx = F0
    for n in range(1, order+1):
        for i in range(n+1):
            if i == 0:
                deriv = G.diff(yy, n)
            elif i == n:
                deriv = G.diff(xx, n)
            else:
                deriv = G.diff(xx, i).diff(yy, n-i)
            deriv = float(deriv.subs(xx=x0).subs(yy=y0))
            coeff = binomial(n, i)/factorial(n)
            approx += coeff * deriv * (x-x0)^i * (y-y0)^(n-i)
    plot += plot3d(approx, (x, 0.4, 1.6),
             (y, 0.4, 1.6), color='red', opacity=0.7)
    html('$F(x,y) = e^{-(x^2+y^2)/2} \\cos(y) \\sin(x^2+y^2)$')
    show(plot)