|
Size: 30302
Comment:
|
Size: 30482
Comment:
|
| Deletions are marked like this. | Additions are marked like this. |
| Line 7: | Line 7: |
| {{{ | {{{#!sagecell |
| Line 18: | Line 18: |
| {{{ | {{{#!sagecell |
| Line 72: | Line 72: |
| {{{ | {{{#!sagecell |
| Line 86: | Line 86: |
| {{{ | {{{#!sagecell |
| Line 94: | Line 94: |
| == Prime Spiral - Square == | == Prime Spiral - Square FIXME == |
| Line 96: | Line 96: |
| {{{ | {{{#!sagecell |
| Line 233: | Line 233: |
| {{{ | {{{#!sagecell |
| Line 305: | Line 305: |
| == Computing modular forms == | == Computing modular forms FIXME == |
| Line 307: | Line 307: |
| {{{ | {{{#!sagecell |
| Line 330: | Line 330: |
| {{{ | {{{#!sagecell |
| Line 340: | Line 340: |
| == A Charpoly and Hecke Operator Graph == | == A Charpoly and Hecke Operator Graph FIXME == |
| Line 343: | Line 343: |
| {{{ | {{{#!sagecell |
| Line 364: | Line 364: |
| == Quadratic Residue Table == | == Quadratic Residue Table FIXME == |
| Line 366: | Line 366: |
| {{{ | {{{#!sagecell |
| Line 417: | Line 417: |
| == Cubic Residue Table == | == Cubic Residue Table FIXME == |
| Line 419: | Line 419: |
| {{{ | {{{#!sagecell |
| Line 437: | Line 437: |
| if Mod(a,3)!=0 and Mod(b,3)==0: return True else: return False |
return Mod(a,3)!=0 and Mod(b,3)==0 |
| Line 503: | Line 500: |
| {{{ | {{{#!sagecell |
| Line 552: | Line 549: |
| S = circle((0,0),1,rgbcolor='yellow') \ + line([e_pt,e_gs_pt], rgbcolor='red', thickness=4) \ + line([f_pt,f_gs_pt], rgbcolor='blue', thickness=3) \ + line([ef_pt,ef_gs_pt], rgbcolor='purple',thickness=2) \ + point(e_pt,pointsize=50, rgbcolor='red') \ + point(f_pt,pointsize=50, rgbcolor='blue') \ + point(ef_pt,pointsize=50,rgbcolor='purple') \ + point(f_gs_pt,pointsize=75, rgbcolor='black') \ + point(e_gs_pt,pointsize=75, rgbcolor='black') \ + point(ef_gs_pt,pointsize=75, rgbcolor='black') \ + point(js_pt,pointsize=100,rgbcolor='green') |
S = circle((0,0),1,rgbcolor='yellow') S += line([e_pt,e_gs_pt], rgbcolor='red', thickness=4) S += line([f_pt,f_gs_pt], rgbcolor='blue', thickness=3) S += line([ef_pt,ef_gs_pt], rgbcolor='purple',thickness=2) S += point(e_pt,pointsize=50, rgbcolor='red') S += point(f_pt,pointsize=50, rgbcolor='blue') S += point(ef_pt,pointsize=50,rgbcolor='purple') S += point(f_gs_pt,pointsize=75, rgbcolor='black') S += point(e_gs_pt,pointsize=75, rgbcolor='black') S += point(ef_gs_pt,pointsize=75, rgbcolor='black') S += point(js_pt,pointsize=100,rgbcolor='green') |
| Line 564: | Line 561: |
| S += text('$J(%s,%s) = %s$'%(latex2(e),latex2(f),latex(js)), \ | S += text('$J(%s,%s) = %s$'%(latex2(e),latex2(f),latex(js)), |
| Line 583: | Line 580: |
| {{{ | {{{#!sagecell |
| Line 632: | Line 629: |
| S = circle((0,0),1,rgbcolor='yellow') \ + line([e_pt,e_gs_pt], rgbcolor='red', thickness=4) \ + line([f_pt,f_gs_pt], rgbcolor='blue', thickness=3) \ + line([ef_pt,ef_gs_pt], rgbcolor='purple',thickness=2) \ + point(e_pt,pointsize=50, rgbcolor='red') \ + point(f_pt,pointsize=50, rgbcolor='blue') \ + point(ef_pt,pointsize=50,rgbcolor='purple') \ + point(f_gs_pt,pointsize=75, rgbcolor='black') \ + point(e_gs_pt,pointsize=75, rgbcolor='black') \ + point(ef_gs_pt,pointsize=75, rgbcolor='black') \ + point(js_pt,pointsize=100,rgbcolor='green') |
S = circle((0,0),1,rgbcolor='yellow') S += line([e_pt,e_gs_pt], rgbcolor='red', thickness=4) S += line([f_pt,f_gs_pt], rgbcolor='blue', thickness=3) S += line([ef_pt,ef_gs_pt], rgbcolor='purple',thickness=2) S += point(e_pt,pointsize=50, rgbcolor='red') S += point(f_pt,pointsize=50, rgbcolor='blue') S += point(ef_pt,pointsize=50,rgbcolor='purple') S += point(f_gs_pt,pointsize=75, rgbcolor='black') S += point(e_gs_pt,pointsize=75, rgbcolor='black') S += point(ef_gs_pt,pointsize=75, rgbcolor='black') S += point(js_pt,pointsize=100,rgbcolor='green') |
| Line 644: | Line 641: |
| S += text('$J(%s,%s) = %s$'%(latex2(e),latex2(f),latex(js)), \ | S += text('$J(%s,%s) = %s$'%(latex2(e),latex2(f),latex(js)), |
| Line 656: | Line 653: |
| ga[i].save('j%d.PNG'%i,figsize=4,aspect_ratio=1, \ | ga[i].save('j%d.png'%i,figsize=4,aspect_ratio=1, |
| Line 662: | Line 659: |
| html('<table bgcolor=lightgrey cellpadding=2>') | s='<table bgcolor=lightgrey cellpadding=2>' |
| Line 664: | Line 661: |
| html('<tr><td align="center"><img src="cell://j%d.PNG"></td>'%(2*i)) html('<td align="center"><img src="cell://j%d.PNG"></td></tr>'%(2*i+1)) html('</table>') }}} |
s+='<tr><td align="center"><img src="cell://j%d.png"></td>'%(2*i) s+='<td align="center"><img src="cell://j%d.png"></td></tr>'%(2*i+1) s+='</table>' html(s)}}} |
| Line 673: | Line 670: |
| == Adding points on an elliptic curve == | == Adding points on an elliptic curve FIXME == |
| Line 675: | Line 672: |
| {{{ | {{{#!sagecell |
| Line 751: | Line 748: |
| {{{ | {{{#!sagecell |
| Line 766: | Line 763: |
| {{{ | {{{#!sagecell |
| Line 780: | Line 777: |
| print """ <html> |
html(""" |
| Line 805: | Line 801: |
| </ol></html> | </ol> |
| Line 807: | Line 803: |
| (g^ b)^a, g^a, b, p, (g^a)^b) | (g^ b)^a, g^a, b, p, (g^a)^b)) |
| Line 815: | Line 811: |
| == Continued Fraction Plotter == | == Continued Fraction Plotter FIXME == |
| Line 817: | Line 813: |
| {{{ | {{{#!sagecell |
| Line 827: | Line 823: |
| {{{ | {{{#!sagecell |
| Line 848: | Line 844: |
| {{{ | {{{#!sagecell |
| Line 856: | Line 852: |
| def _(gen = selector(['t+1', 't-1', '-1/t'], nrows=1)): | def _(gen = selector(['t+1', 't-1', '-1/t'], buttons=True,nrows=1)): |
Contents
Integer Factorization
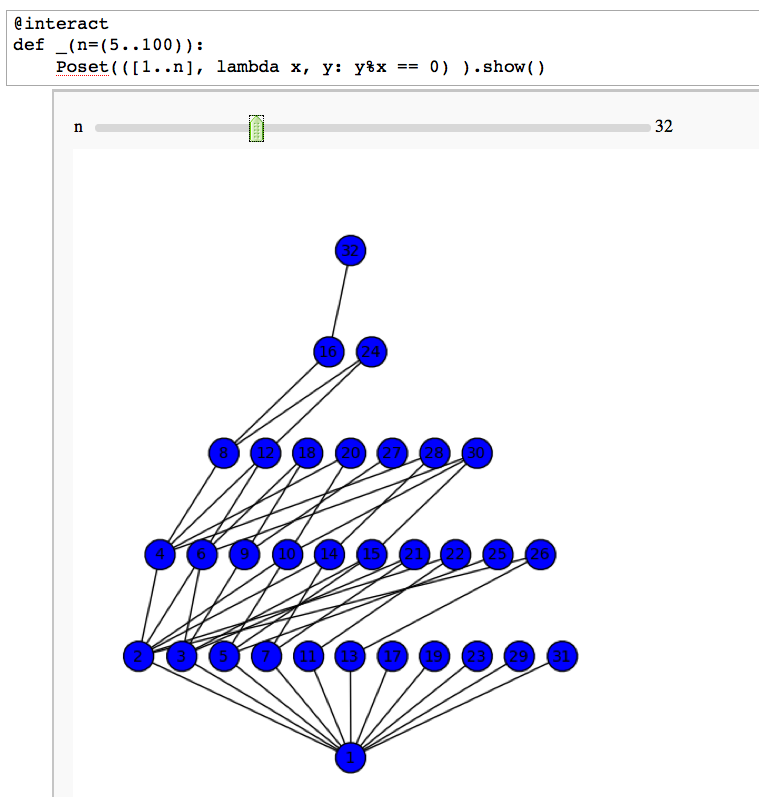
Divisibility Poset
by William Stein
Factor Trees
by William Stein
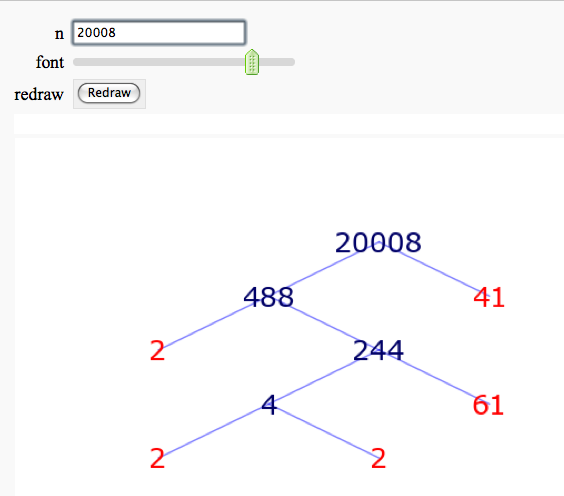
More complicated demonstration using Mathematica: http://demonstrations.wolfram.com/FactorTrees/
Factoring an Integer
by Timothy Clemans
Sage implementation of the Mathematica demonstration of the same name. http://demonstrations.wolfram.com/FactoringAnInteger/
Prime Numbers
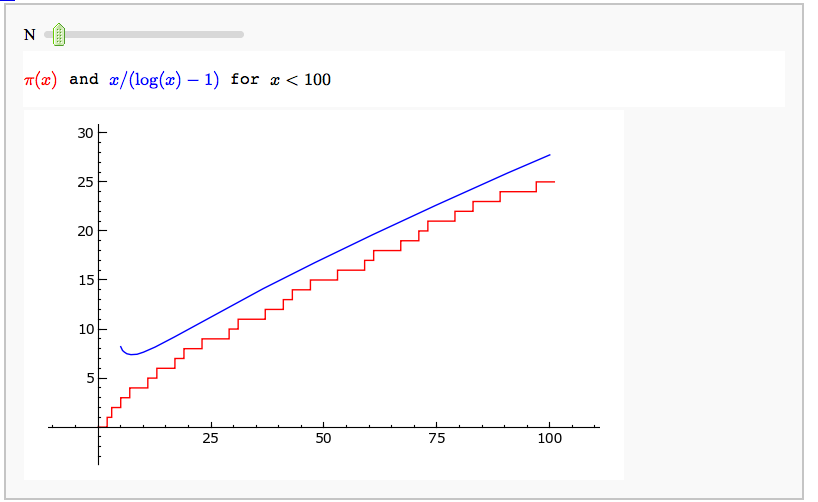
Illustrating the prime number theorem
by William Stein
Prime Spiral - Square FIXME
by David Runde
Prime Spiral - Polar
by David Runde
Modular Forms
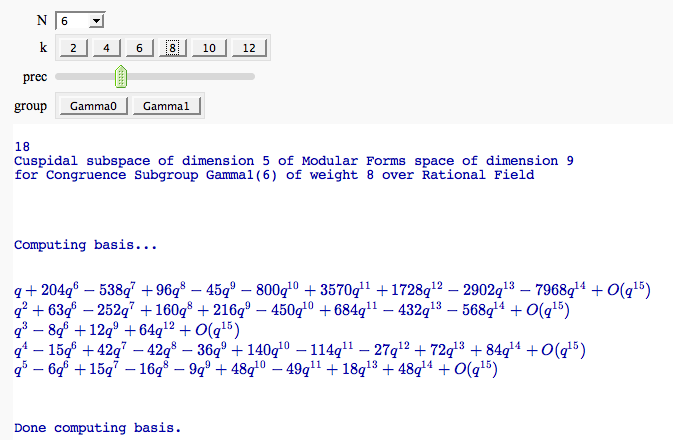
Computing modular forms FIXME
by William Stein
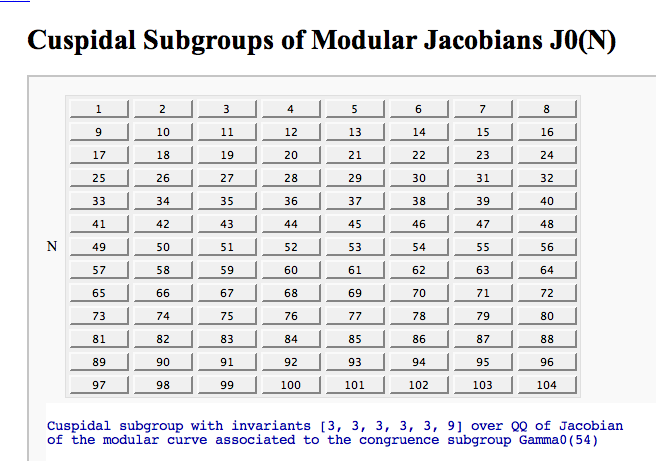
Computing the cuspidal subgroup
by William Stein
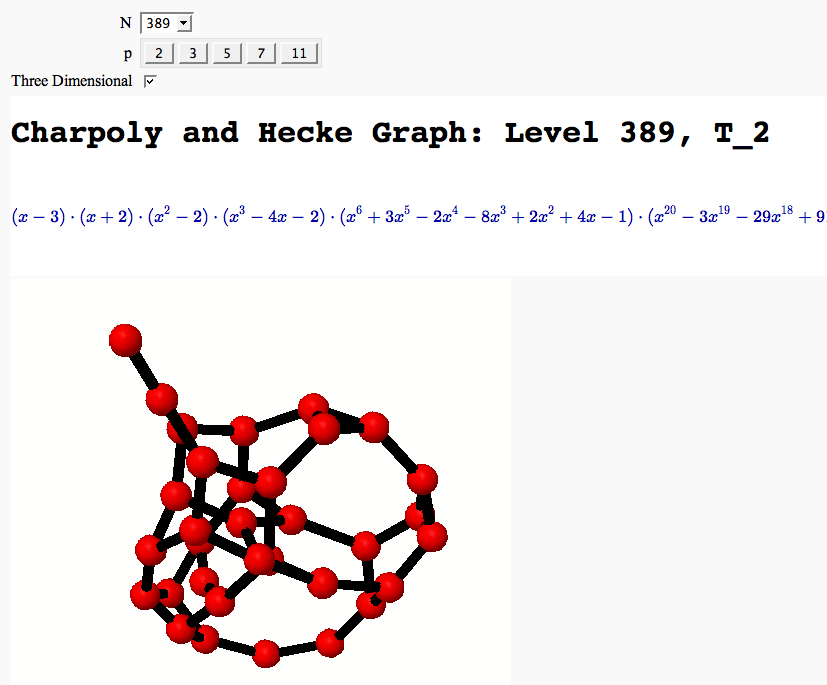
A Charpoly and Hecke Operator Graph FIXME
by William Stein
Modular Arithmetic
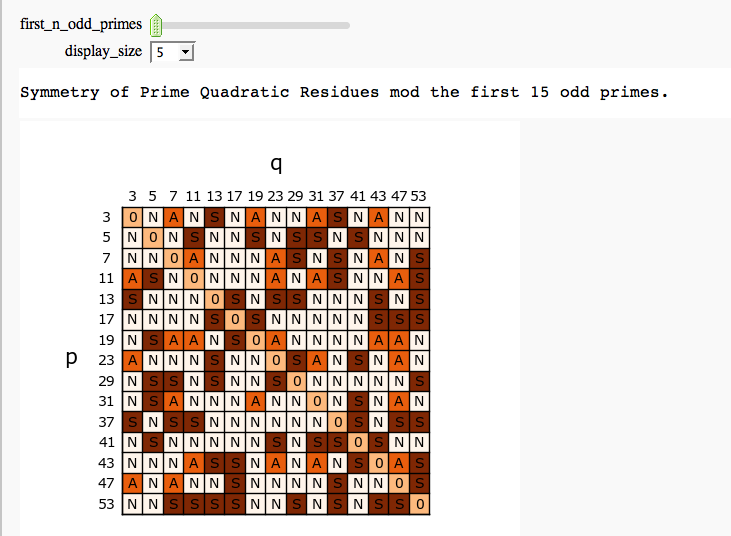
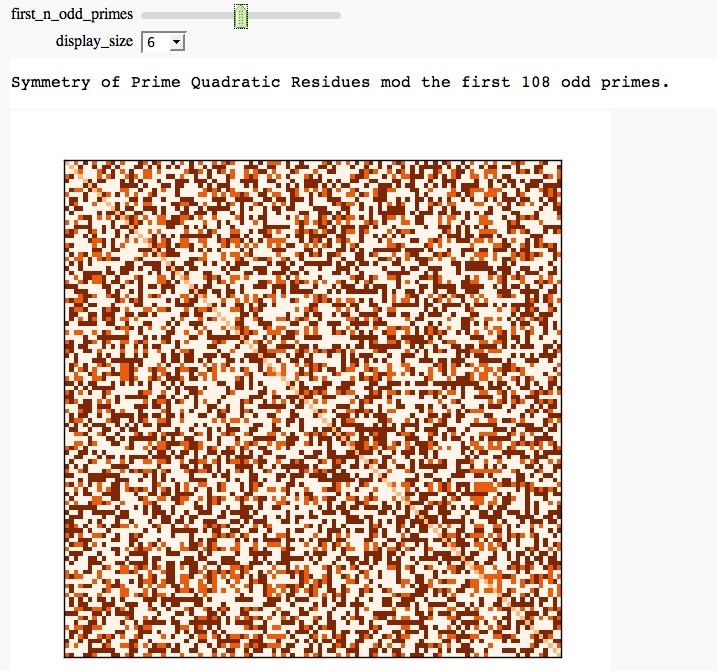
Quadratic Residue Table FIXME
by Emily Kirkman
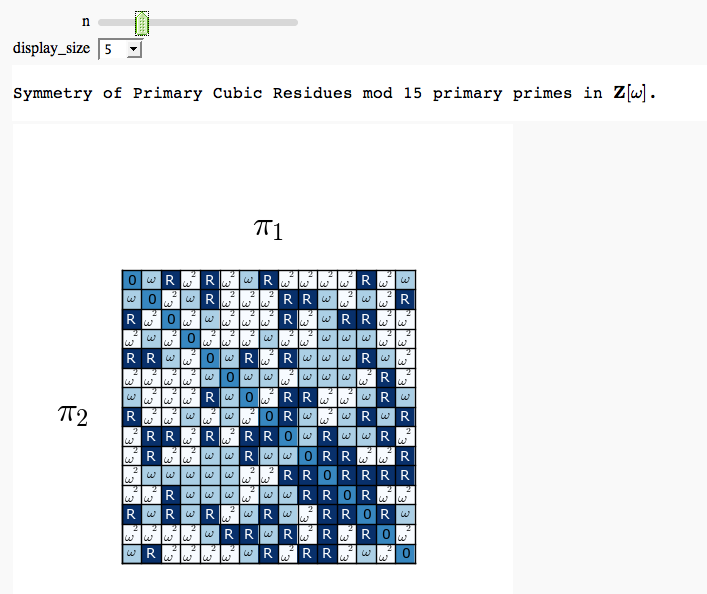
Cubic Residue Table FIXME
by Emily Kirkman
Cyclotomic Fields
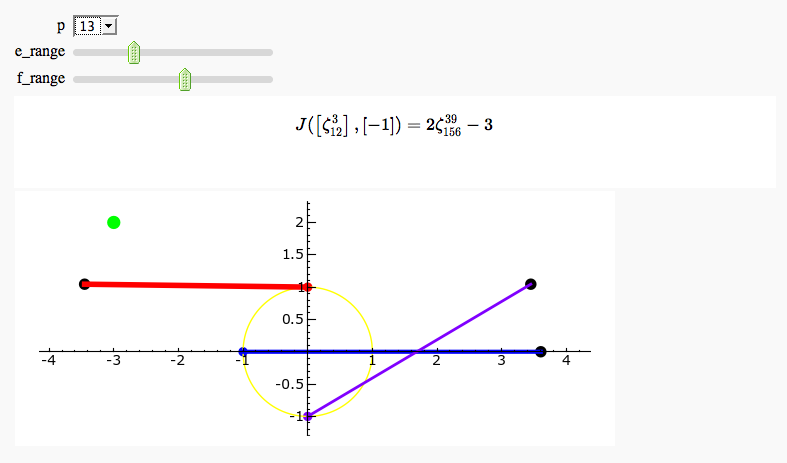
Gauss and Jacobi Sums in Complex Plane
by Emily Kirkman
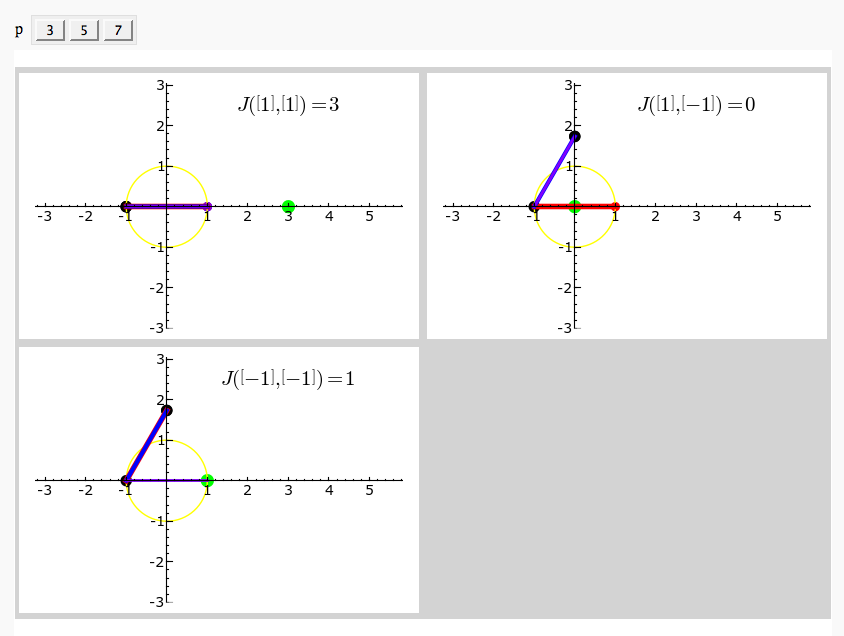
Exhaustive Jacobi Plotter
by Emily Kirkman
Elliptic Curves
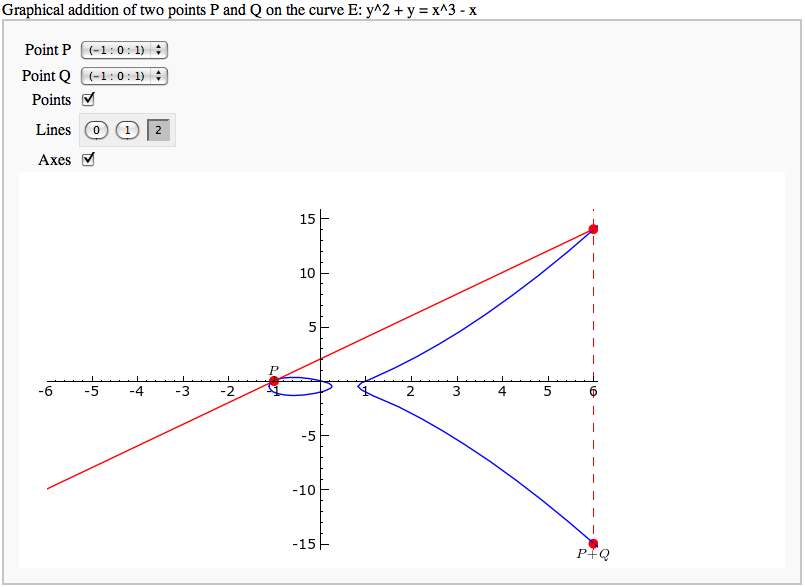
Adding points on an elliptic curve FIXME
by David Møller Hansen
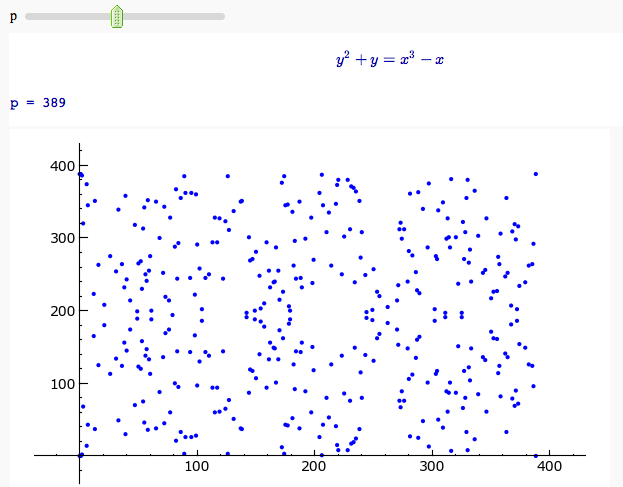
Plotting an elliptic curve over a finite field
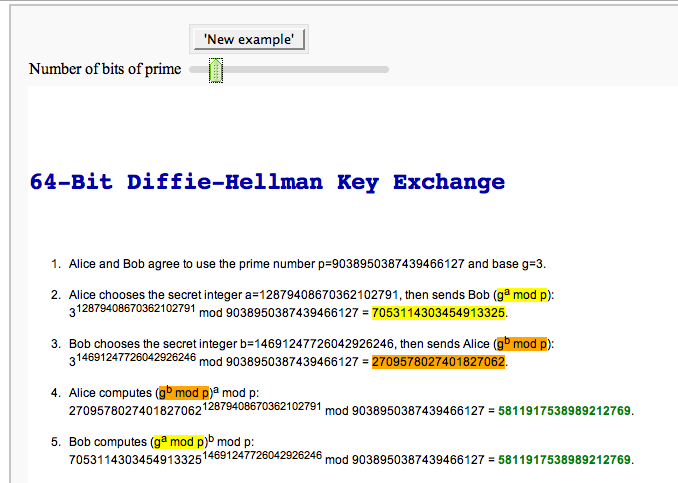
Cryptography
The Diffie-Hellman Key Exchange Protocol
by Timothy Clemans and William Stein
Other
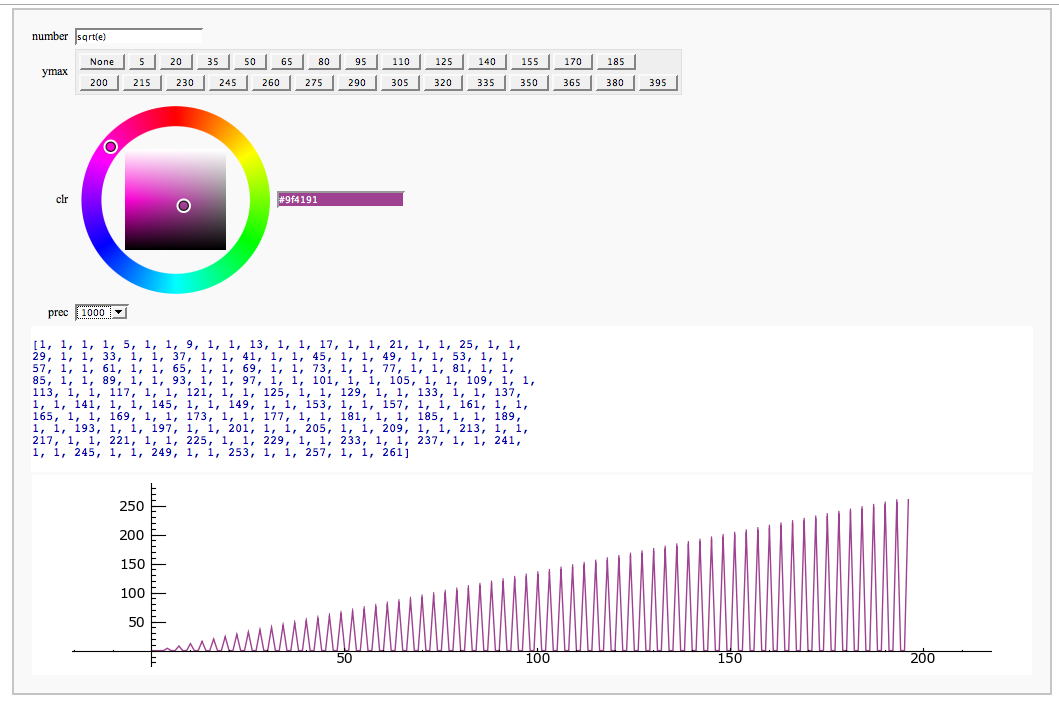
Continued Fraction Plotter FIXME
by William Stein
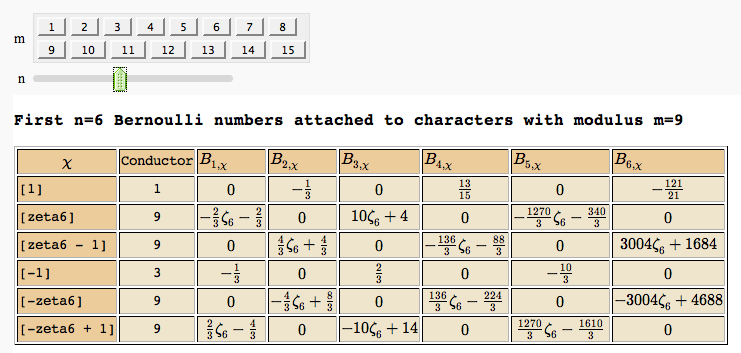
Computing Generalized Bernoulli Numbers
by William Stein (Sage-2.10.3)
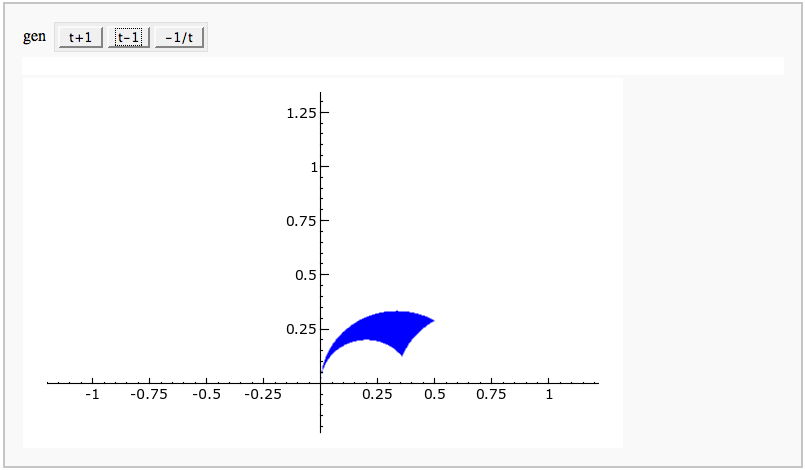
Fundamental Domains of SL_2(ZZ)
by Robert Miller
