|
Size: 26468
Comment:
|
Size: 30348
Comment: fixed Continued Fraction Plotter, more or less
|
| Deletions are marked like this. | Additions are marked like this. |
| Line 1: | Line 1: |
| = Sage Interactions - Number Theory = goto [:interact:interact main page] [[TableOfContents]] |
<<TableOfContents>> = Integer Factorization = == Divisibility Poset == by William Stein {{{#!sagecell @interact def _(n=(5..100)): Poset(([1..n], lambda x, y: y%x == 0) ).show() }}} {{attachment:divposet.png}} |
| Line 8: | Line 18: |
| {{{ | {{{#!sagecell |
| Line 41: | Line 51: |
| g += line([(j*2-len(cur),-i), ((k*2)-len(rows[i-1]),-i+1)], | g += line([(j*2-len(cur),-i), ((k*2)-len(rows[i-1]),-i+1)], |
| Line 53: | Line 63: |
| attachment:factortree.png === Continued Fraction Plotter === |
{{attachment:factortree.png}} More complicated demonstration using Mathematica: http://demonstrations.wolfram.com/FactorTrees/ == Factoring an Integer == by Timothy Clemans Sage implementation of the Mathematica demonstration of the same name. http://demonstrations.wolfram.com/FactoringAnInteger/ {{{#!sagecell @interact def _(r=selector(range(0,10000,1000), label='range', buttons=True), n=slider(0,1000,1,2,'n',False)): if not r and n in (0, 1): n = 2 s = '$%d = %s$' % (r + n, factor(r + n)) s = s.replace('*', '\\times') html(s) }}} = Prime Numbers = == Illustrating the prime number theorem == |
| Line 57: | Line 86: |
| {{{ @interact def _(number=e, ymax=selector([None,5,20,..,400],nrows=2), clr=Color('purple'), prec=[500,1000,..,5000]): c = list(continued_fraction(RealField(prec)(number))); print c show(line([(i,z) for i, z in enumerate(c)],rgbcolor=clr),ymax=ymax,figsize=[10,2]) }}} attachment:contfracplot.png === Illustrating the prime number thoerem === by William Stein {{{ |
{{{#!sagecell |
| Line 73: | Line 92: |
| attachment:primes.png === Computing Generalized Bernoulli Numbers === by William Stein (Sage-2.10.3) {{{ @interact def _(m=selector([1..15],nrows=2), n=(7,(3..10))): G = DirichletGroup(m) s = "<h3>First n=%s Bernoulli numbers attached to characters with modulus m=%s</h3>"%(n,m) s += '<table border=1>' s += '<tr bgcolor="#edcc9c"><td align=center>$\\chi$</td><td>Conductor</td>' + \ ''.join('<td>$B_{%s,\chi}$</td>'%k for k in [1..n]) + '</tr>' for eps in G.list(): v = ''.join(['<td align=center bgcolor="#efe5cd">$%s$</td>'%latex(eps.bernoulli(k)) for k in [1..n]]) s += '<tr><td bgcolor="#edcc9c">%s</td><td bgcolor="#efe5cd" align=center>%s</td>%s</tr>\n'%( eps, eps.conductor(), v) s += '</table>' html(s) }}} attachment:bernoulli.png === Fundamental Domains of SL_2(ZZ) === by Robert Miller {{{ L = [[-0.5, 2.0^(x/100.0) - 1 + sqrt(3.0)/2] for x in xrange(1000, -1, -1)] R = [[0.5, 2.0^(x/100.0) - 1 + sqrt(3.0)/2] for x in xrange(1000)] xes = [x/1000.0 for x in xrange(-500,501,1)] M = [[x,abs(sqrt(x^2-1))] for x in xes] fundamental_domain = L+M+R fundamental_domain = [[x-1,y] for x,y in fundamental_domain] @interact def _(gen = selector(['t+1', 't-1', '-1/t'], nrows=1)): global fundamental_domain if gen == 't+1': fundamental_domain = [[x+1,y] for x,y in fundamental_domain] elif gen == 't-1': fundamental_domain = [[x-1,y] for x,y in fundamental_domain] elif gen == '-1/t': new_dom = [] for x,y in fundamental_domain: sq_mod = x^2 + y^2 new_dom.append([(-1)*x/sq_mod, y/sq_mod]) fundamental_domain = new_dom P = polygon(fundamental_domain) P.ymax(1.2); P.ymin(-0.1) P.show() }}} attachment:fund_domain.png === Computing modular forms === by William Stein {{{ j = 0 @interact def _(N=[1..100], k=selector([2,4,..,12],nrows=1), prec=(3..40), group=[(Gamma0, 'Gamma0'), (Gamma1, 'Gamma1')]): M = CuspForms(group(N),k) print j; global j; j += 1 print M; print '\n'*3 print "Computing basis...\n\n" if M.dimension() == 0: print "Space has dimension 0" else: prec = max(prec, M.dimension()+1) for f in M.basis(): view(f.q_expansion(prec)) print "\n\n\nDone computing basis." }}} attachment:modformbasis.png === Computing the cuspidal subgroup === by William Stein {{{ html('<h1>Cuspidal Subgroups of Modular Jacobians J0(N)</h1>') @interact def _(N=selector([1..8*13], ncols=8, width=10, default=10)): A = J0(N) print A.cuspidal_subgroup() }}} attachment:cuspgroup.png === A Charpoly and Hecke Operator Graph === by William Stein {{{ # Note -- in Sage-2.10.3; multiedges are missing in plots; loops are missing in 3d plots @interact def f(N = prime_range(11,400), p = selector(prime_range(2,12),nrows=1), three_d = ("Three Dimensional", False)): S = SupersingularModule(N) T = S.hecke_matrix(p) G = Graph(T, multiedges=True, loops=not three_d) html("<h1>Charpoly and Hecke Graph: Level %s, T_%s</h1>"%(N,p)) show(T.charpoly().factor()) if three_d: show(G.plot3d(), aspect_ratio=[1,1,1]) else: show(G.plot(),figsize=7) }}} attachment:heckegraph.png === Demonstrating the Diffie-Hellman Key Exchange Protocol === by Timothy Clemans (refereed by William Stein) {{{ @interact def diffie_hellman(button=selector(["New example"],label='',buttons=True), bits=("Number of bits of prime", (8,12,..512))): maxp = 2^bits p = random_prime(maxp) k = GF(p) if bits>100: g = k(2) else: g = k.multiplicative_generator() a = ZZ.random_element(10, maxp) b = ZZ.random_element(10, maxp) print """ <html> <style> .gamodp { background:yellow } .gbmodp { background:orange } .dhsame { color:green; font-weight:bold } </style> <h2>%s-Bit Diffie-Hellman Key Exchange</h2> <ol style="color:#000;font:12px Arial, Helvetica, sans-serif"> <li>Alice and Bob agree to use the prime number p=%s and base g=%s.</li> <li>Alice chooses the secret integer a=%s, then sends Bob (<span class="gamodp">g<sup>a</sup> mod p</span>):<br/>%s<sup>%s</sup> mod %s = <span class="gamodp">%s</span>.</li> <li>Bob chooses the secret integer b=%s, then sends Alice (<span class="gbmodp">g<sup>b</sup> mod p</span>):<br/>%s<sup>%s</sup> mod %s = <span class="gbmodp">%s</span>.</li> <li>Alice computes (<span class="gbmodp">g<sup>b</sup> mod p</span>)<sup>a</sup> mod p:<br/>%s<sup>%s</sup> mod %s = <span class="dhsame">%s</span>.</li> <li>Bob computes (<span class="gamodp">g<sup>a</sup> mod p</span>)<sup>b</sup> mod p:<br/>%s<sup>%s</sup> mod %s = <span class="dhsame">%s</span>.</li> </ol></html> """ % (bits, p, g, a, g, a, p, (g^a), b, g, b, p, (g^b), (g^b), a, p, (g^ b)^a, g^a, b, p, (g^a)^b) }}} attachment:dh.png === Plotting an elliptic curve over a finite field === {{{ E = EllipticCurve('37a') @interact def _(p=slider(prime_range(1000), default=389)): show(E) print "p = %s"%p show(E.change_ring(GF(p)).plot(),xmin=0,ymin=0) }}} attachment:ellffplot.png === Prime Spiral - Square === |
{{attachment:primes.png}} == Prime Spiral - Square FIXME == |
| Line 240: | Line 96: |
| {{{ | {{{#!sagecell |
| Line 245: | Line 101: |
| REFERENCES: | REFERENCES: |
| Line 250: | Line 106: |
| Weisstein, Eric W. "Prime-Generating Polynomial." From MathWorld--A Wolfram Web Resource. http://mathworld.wolfram.com/Prime-GeneratingPolynomial.html | Weisstein, Eric W. "Prime-Generating Polynomial." From MathWorld--A Wolfram Web Resource. http://mathworld.wolfram.com/Prime-GeneratingPolynomial.html |
| Line 258: | Line 114: |
| elif y<0 and -x >= y and y<x: return 4*(y+1)^2 -11*(y+1) + (start+7) +x | elif y<0 and -x >= y and y<x: return 4*(y+1)^2 -11*(y+1) + (start+7) +x |
| Line 261: | Line 117: |
| #Takes in an n and the start value of the spiral and gives its (x,y) coordinate | #Takes in an n and the start value of the spiral and gives its (x,y) coordinate |
| Line 263: | Line 119: |
| num = num - start +1 | num = num - start +1 |
| Line 265: | Line 121: |
| top = ceil(sqrt(num)) | top = ceil(sqrt(num)) |
| Line 270: | Line 126: |
| else: | else: |
| Line 277: | Line 133: |
| else: | else: |
| Line 289: | Line 145: |
| N = M.copy() | N = copy(M) |
| Line 293: | Line 149: |
| #These functions return an int based on where the t is located in the spiral |
#These functions return an int based on where the t is located in the spiral |
| Line 306: | Line 162: |
| if n !=0: x_cord, y_cord = find_xy(n, start) #Overrides the user given x and y coordinates | if n !=0: x_cord, y_cord = find_xy(n, start) #Overrides the user given x and y coordinates |
| Line 314: | Line 170: |
| Line 317: | Line 173: |
| if show_lines: for t in [(-size-1)..size+1]: |
if show_lines: for t in [(-size-1)..size+1]: |
| Line 320: | Line 176: |
| if m.is_pseudoprime(): main_list.add(m) | if m.is_pseudoprime(): main_list.add(m) |
| Line 325: | Line 181: |
| #This for loop changes the matrix by spiraling out from the center and changing each entry as it goes. It is faster than the find_xy function above. | #This for loop changes the matrix by spiraling out from the center and changing each entry as it goes. It is faster than the find_xy function above. |
| Line 330: | Line 186: |
| else: x-=1 | else: x-=1 |
| Line 332: | Line 188: |
| elif county < overcount: |
elif county < overcount: |
| Line 335: | Line 191: |
| else: y-=1 | else: y-=1 |
| Line 337: | Line 193: |
| else: | else: |
| Line 343: | Line 199: |
| if not invert and num in main_list: |
if not invert and num in main_list: |
| Line 351: | Line 207: |
| if n != 0: |
if n != 0: |
| Line 368: | Line 224: |
| else: | else: |
| Line 373: | Line 229: |
| attachment:SquareSpiral.PNG === Prime Spiral - Polar === |
{{attachment:SquareSpiral.PNG}} == Prime Spiral - Polar == |
| Line 377: | Line 233: |
| {{{ @interact def polar_prime_spiral(start=1, end=2000, show_factors = false, highlight_primes = false, show_curves=true, n = 0): #For more information about the factors in the spiral, visit http://www.dcs.gla.ac.uk/~jhw/spirals/index.html by John Williamson. |
{{{#!sagecell @interact def polar_prime_spiral(start=1, end=2000, show_factors = false, highlight_primes = false, show_curves=true, n = 0): #For more information about the factors in the spiral, visit http://www.dcs.gla.ac.uk/~jhw/spirals/index.html by John Williamson. |
| Line 387: | Line 243: |
| Line 395: | Line 251: |
| R = points(list2, alpha = .1) #Faded Composites else: |
R = points(list2, alpha = .1) #Faded Composites else: |
| Line 403: | Line 259: |
| R=points(list2, hue = .1, pointsize = p_size) |
R=points(list2, hue = .1, pointsize = p_size) |
| Line 407: | Line 263: |
| Line 414: | Line 270: |
| Q = plot(W1+W2+W3+W4, alpha = .1) | Q = plot(W1+W2+W3+W4, alpha = .1) |
| Line 417: | Line 273: |
| if show_curves: | if show_curves: |
| Line 422: | Line 278: |
| if n > (floor(sqrt(n)))^2 and n <= (floor(sqrt(n)))^2 + floor(sqrt(n)): | if n > (floor(sqrt(n)))^2 and n <= (floor(sqrt(n)))^2 + floor(sqrt(n)): |
| Line 425: | Line 281: |
| else: | else: |
| Line 430: | Line 286: |
| def g(m): return (a*m^2+b*m+c); | def g(m): return (a*m^2+b*m+c); |
| Line 436: | Line 292: |
| c= c2; | c= c2; |
| Line 444: | Line 300: |
| attachment:PolarSpiral.PNG === Quadratic Residue Table === |
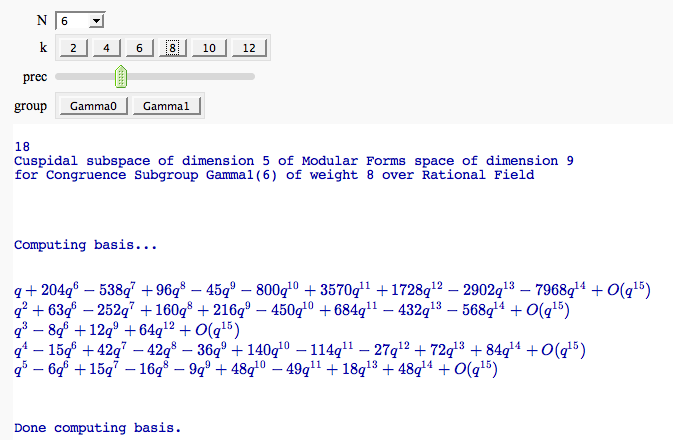
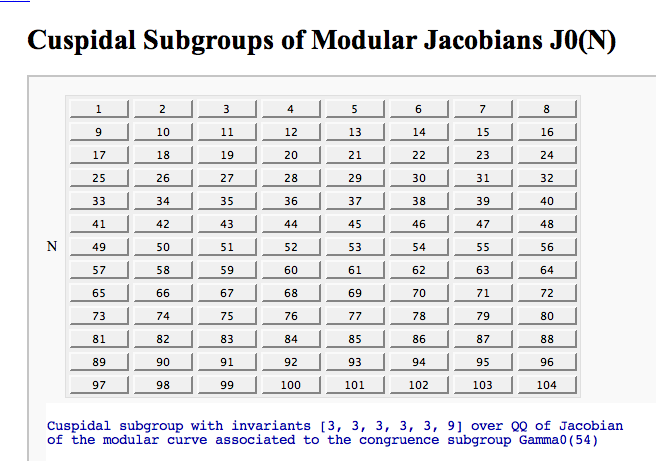
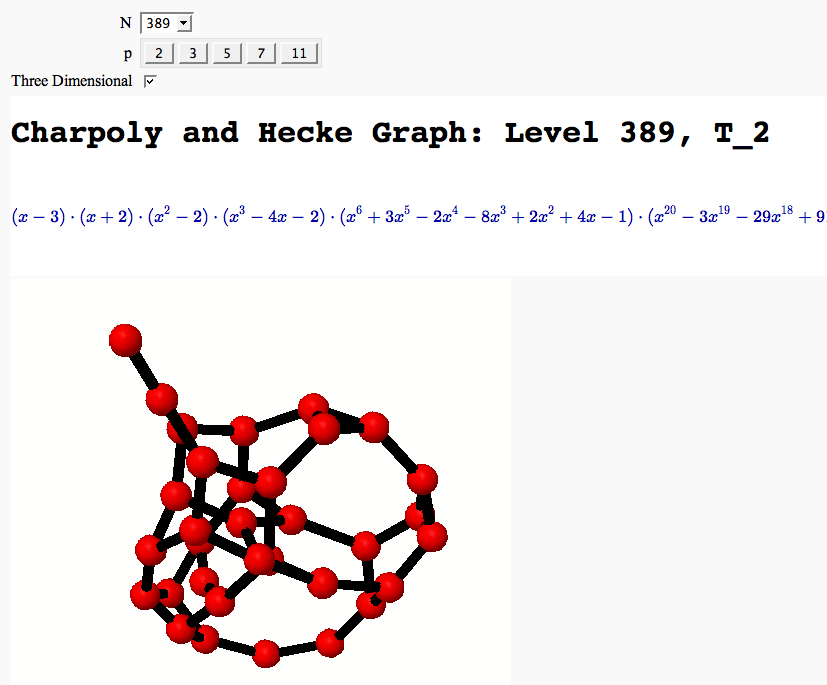
{{attachment:PolarSpiral.PNG}} = Modular Forms = == Computing modular forms == by William Stein {{{#!sagecell @interact def _(N=[1..100], k=selector([2,4,..,12],nrows=1), prec=(3..40), group=[(Gamma0, 'Gamma0'), (Gamma1, 'Gamma1')]): M = CuspForms(group(N),k) print M; print '\n'*3 print "Computing basis...\n\n" if M.dimension() == 0: print "Space has dimension 0" else: prec = max(prec, M.dimension()+1) for f in M.basis(): view(f.q_expansion(prec)) print "\n\n\nDone computing basis." }}} {{attachment:modformbasis.png}} == Computing the cuspidal subgroup == by William Stein {{{#!sagecell html('<h1>Cuspidal Subgroups of Modular Jacobians J0(N)</h1>') @interact def _(N=selector([1..8*13], ncols=8, width=10, default=10)): A = J0(N) print A.cuspidal_subgroup() }}} {{attachment:cuspgroup.png}} == A Charpoly and Hecke Operator Graph == by William Stein {{{#!sagecell # Note -- in Sage-2.10.3; multiedges are missing in plots; loops are missing in 3d plots @interact def f(N = prime_range(11,400), p = selector(prime_range(2,12),nrows=1), three_d = ("Three Dimensional", False)): S = SupersingularModule(N) T = S.hecke_matrix(p) G = DiGraph(T, multiedges=not three_d) if three_d: G.remove_loops() html("<h1>Charpoly and Hecke Graph: Level %s, T_%s</h1>"%(N,p)) show(T.charpoly().factor()) if three_d: show(G.plot3d(), aspect_ratio=[1,1,1]) else: show(G.plot(),figsize=7) }}} {{attachment:heckegraph.png}} = Modular Arithmetic = == Quadratic Residue Table FIXME == |
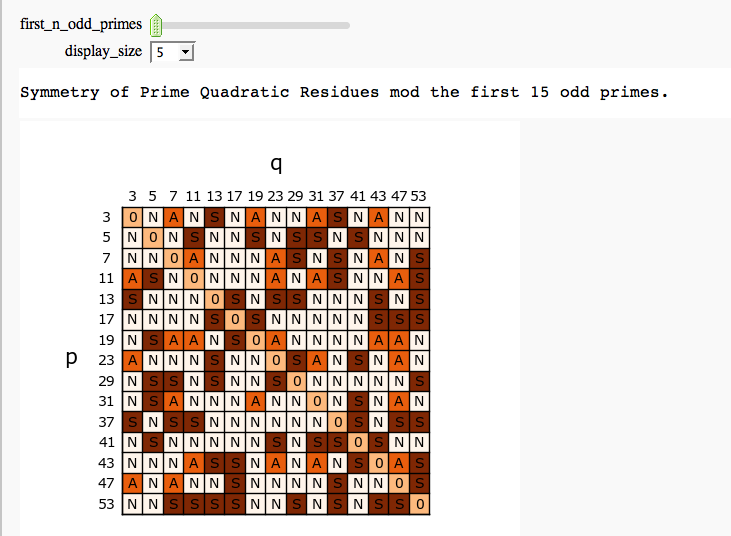
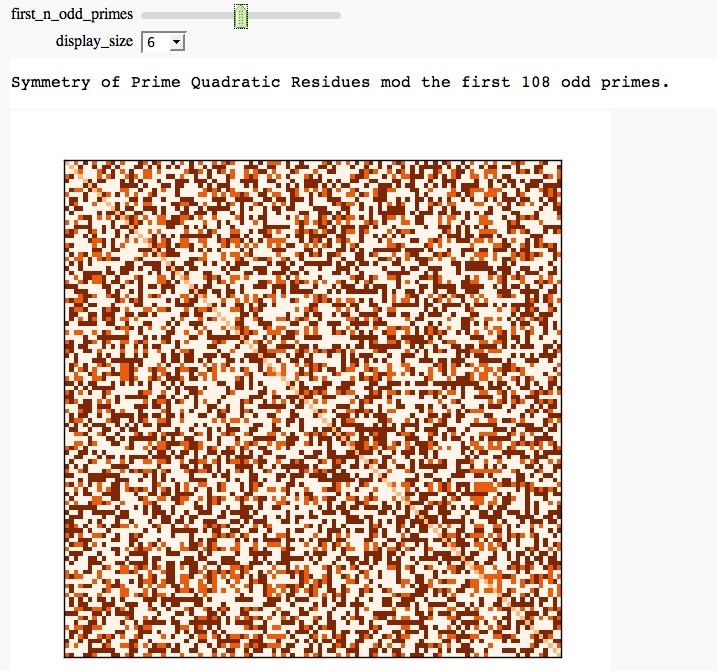
| Line 448: | Line 366: |
| {{{ | {{{#!sagecell |
| Line 495: | Line 413: |
| attachment:quadres.png attachment:quadresbig.png === Cubic Residue Table === |
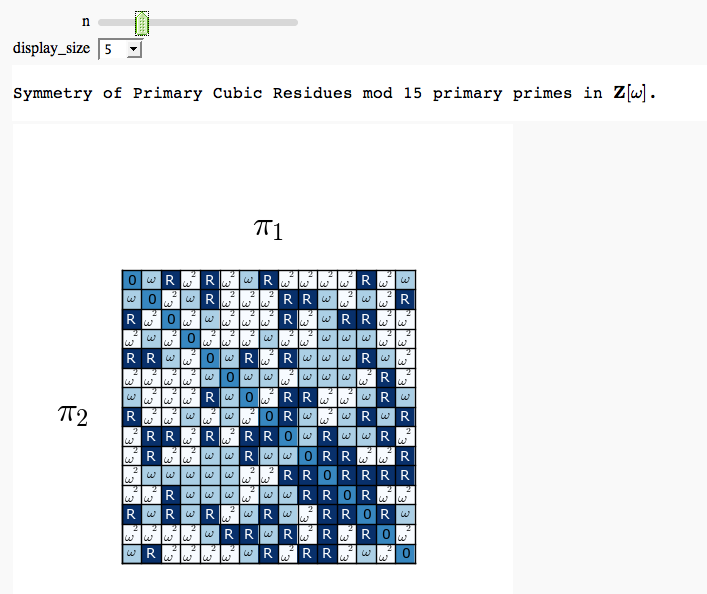
{{attachment:quadres.png}} {{attachment:quadresbig.png}} == Cubic Residue Table FIXME == |
| Line 501: | Line 419: |
| {{{ | {{{#!sagecell |
| Line 519: | Line 437: |
| if Mod(a,3)!=0 and Mod(b,3)==0: return True else: return False |
return Mod(a,3)!=0 and Mod(b,3)==0 |
| Line 557: | Line 472: |
| MP += line([(i,0),(i,r)], rgbcolor='black') | MP += line([(i,0),(i,r)], rgbcolor='black') |
| Line 579: | Line 494: |
| attachment:cubres.png === Gauss and Jacobi Sums in Complex Plane === |
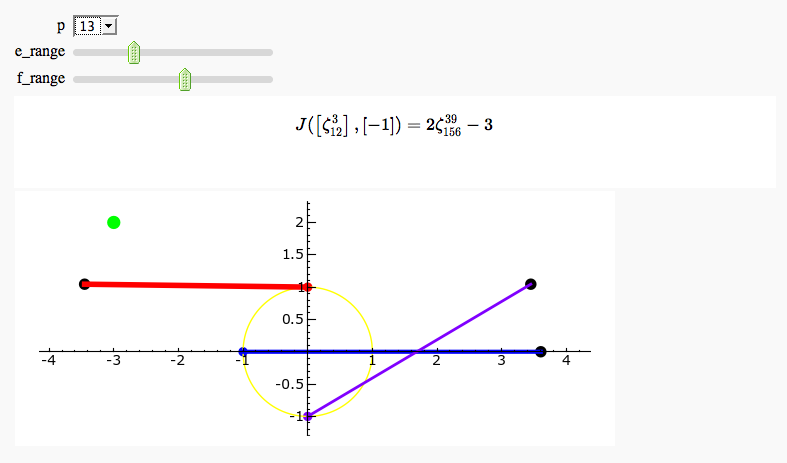
{{attachment:cubres.png}} = Cyclotomic Fields = == Gauss and Jacobi Sums in Complex Plane == |
| Line 583: | Line 500: |
| {{{ | {{{#!sagecell |
| Line 632: | Line 549: |
| S = circle((0,0),1,rgbcolor='yellow') \ + line([e_pt,e_gs_pt], rgbcolor='red', thickness=4) \ + line([f_pt,f_gs_pt], rgbcolor='blue', thickness=3) \ + line([ef_pt,ef_gs_pt], rgbcolor='purple',thickness=2) \ + point(e_pt,pointsize=50, rgbcolor='red') \ + point(f_pt,pointsize=50, rgbcolor='blue') \ + point(ef_pt,pointsize=50,rgbcolor='purple') \ + point(f_gs_pt,pointsize=75, rgbcolor='black') \ + point(e_gs_pt,pointsize=75, rgbcolor='black') \ + point(ef_gs_pt,pointsize=75, rgbcolor='black') \ + point(js_pt,pointsize=100,rgbcolor='green') |
S = circle((0,0),1,rgbcolor='yellow') S += line([e_pt,e_gs_pt], rgbcolor='red', thickness=4) S += line([f_pt,f_gs_pt], rgbcolor='blue', thickness=3) S += line([ef_pt,ef_gs_pt], rgbcolor='purple',thickness=2) S += point(e_pt,pointsize=50, rgbcolor='red') S += point(f_pt,pointsize=50, rgbcolor='blue') S += point(ef_pt,pointsize=50,rgbcolor='purple') S += point(f_gs_pt,pointsize=75, rgbcolor='black') S += point(e_gs_pt,pointsize=75, rgbcolor='black') S += point(ef_gs_pt,pointsize=75, rgbcolor='black') S += point(js_pt,pointsize=100,rgbcolor='green') |
| Line 644: | Line 561: |
| S += text('$J(%s,%s) = %s$'%(latex2(e),latex2(f),latex(js)), \ | S += text('$J(%s,%s) = %s$'%(latex2(e),latex2(f),latex(js)), |
| Line 659: | Line 576: |
| attachment:jacobising.png === Exhaustive Jacobi Plotter === |
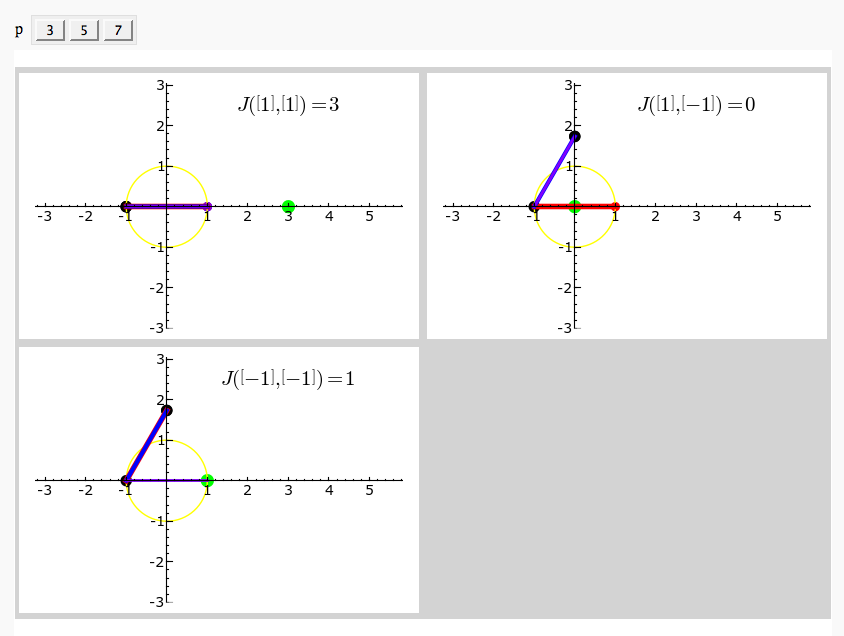
{{attachment:jacobising.png}} == Exhaustive Jacobi Plotter == |
| Line 663: | Line 580: |
| {{{ | {{{#!sagecell |
| Line 712: | Line 629: |
| S = circle((0,0),1,rgbcolor='yellow') \ + line([e_pt,e_gs_pt], rgbcolor='red', thickness=4) \ + line([f_pt,f_gs_pt], rgbcolor='blue', thickness=3) \ + line([ef_pt,ef_gs_pt], rgbcolor='purple',thickness=2) \ + point(e_pt,pointsize=50, rgbcolor='red') \ + point(f_pt,pointsize=50, rgbcolor='blue') \ + point(ef_pt,pointsize=50,rgbcolor='purple') \ + point(f_gs_pt,pointsize=75, rgbcolor='black') \ + point(e_gs_pt,pointsize=75, rgbcolor='black') \ + point(ef_gs_pt,pointsize=75, rgbcolor='black') \ + point(js_pt,pointsize=100,rgbcolor='green') |
S = circle((0,0),1,rgbcolor='yellow') S += line([e_pt,e_gs_pt], rgbcolor='red', thickness=4) S += line([f_pt,f_gs_pt], rgbcolor='blue', thickness=3) S += line([ef_pt,ef_gs_pt], rgbcolor='purple',thickness=2) S += point(e_pt,pointsize=50, rgbcolor='red') S += point(f_pt,pointsize=50, rgbcolor='blue') S += point(ef_pt,pointsize=50,rgbcolor='purple') S += point(f_gs_pt,pointsize=75, rgbcolor='black') S += point(e_gs_pt,pointsize=75, rgbcolor='black') S += point(ef_gs_pt,pointsize=75, rgbcolor='black') S += point(js_pt,pointsize=100,rgbcolor='green') |
| Line 724: | Line 641: |
| S += text('$J(%s,%s) = %s$'%(latex2(e),latex2(f),latex(js)), \ | S += text('$J(%s,%s) = %s$'%(latex2(e),latex2(f),latex(js)), |
| Line 736: | Line 653: |
| ga[i].save('j%d.PNG'%i,figsize=4,aspect_ratio=1, \ | ga[i].save('j%d.png'%i,figsize=4,aspect_ratio=1, |
| Line 742: | Line 659: |
| html('<table bgcolor=lightgrey cellpadding=2>') | s='<table bgcolor=lightgrey cellpadding=2>' |
| Line 744: | Line 661: |
| html('<tr><td align="center"><img src="cell://j%d.PNG"></td>'%(2*i)) html('<td align="center"><img src="cell://j%d.PNG"></td></tr>'%(2*i+1)) html('</table>') }}} attachment:jacobiexh.png |
s+='<tr><td align="center"><img src="cell://j%d.png"></td>'%(2*i) s+='<td align="center"><img src="cell://j%d.png"></td></tr>'%(2*i+1) s+='</table>' html(s)}}} {{attachment:jacobiexh.png}} = Elliptic Curves = == Adding points on an elliptic curve == by David Møller Hansen {{{#!sagecell def point_txt(P,name,rgbcolor): if (P.xy()[1]) < 0: r = text(name,[float(P.xy()[0]),float(P.xy()[1])-1],rgbcolor=rgbcolor) elif P.xy()[1] == 0: r = text(name,[float(P.xy()[0]),float(P.xy()[1])+1],rgbcolor=rgbcolor) else: r = text(name,[float(P.xy()[0]),float(P.xy()[1])+1],rgbcolor=rgbcolor) return r E = EllipticCurve('37a') list_of_points = E.integral_points() html("Graphical addition of two points $P$ and $Q$ on the curve $ E: %s $"%latex(E)) def line_from_curve_points(E,P,Q,style='-',rgb=(1,0,0),length=25): """ P,Q two points on an elliptic curve. Output is a graphic representation of the straight line intersecting with P,Q. """ # The function tangent to P=Q on E if P == Q: if P[2]==0: return line([(1,-length),(1,length)],linestyle=style,rgbcolor=rgb) else: # Compute slope of the curve E in P l=-(3*P[0]^2 + 2*E.a2()*P[0] + E.a4() - E.a1()*P[1])/((-2)*P[1] - E.a1()*P[0] - E.a3()) f(x) = l * (x - P[0]) + P[1] return plot(f(x),-length,length,linestyle=style,rgbcolor=rgb) # Trivial case of P != R where P=O or R=O then we get the vertical line from the other point elif P[2] == 0: return line([(Q[0],-length),(Q[0],length)],linestyle=style,rgbcolor=rgb) elif Q[2] == 0: return line([(P[0],-length),(P[0],length)],linestyle=style,rgbcolor=rgb) # Non trivial case where P != R else: # Case where x_1 = x_2 return vertical line evaluated in Q if P[0] == Q[0]: return line([(P[0],-length),(P[0],length)],linestyle=style,rgbcolor=rgb) #Case where x_1 != x_2 return line trough P,R evaluated in Q" l=(Q[1]-P[1])/(Q[0]-P[0]) f(x) = l * (x - P[0]) + P[1] return plot(f(x),-length,length,linestyle=style,rgbcolor=rgb) @interact def _(P=selector(list_of_points,label='Point P'),Q=selector(list_of_points,label='Point Q'), marked_points = checkbox(default=True,label = 'Points'), Lines = selector([0..2],nrows=1), Axes=True): curve = E.plot(rgbcolor = (0,0,1),xmin=-5,xmax=5,plot_points=300) R = P + Q Rneg = -R l1 = line_from_curve_points(E,P,Q) l2 = line_from_curve_points(E,R,Rneg,style='--') p1 = plot(P,rgbcolor=(1,0,0),pointsize=40) p2 = plot(Q,rgbcolor=(1,0,0),pointsize=40) p3 = plot(R,rgbcolor=(1,0,0),pointsize=40) p4 = plot(Rneg,rgbcolor=(1,0,0),pointsize=40) textp1 = point_txt(P,"$P$",rgbcolor=(0,0,0)) textp2 = point_txt(Q,"$Q$",rgbcolor=(0,0,0)) textp3 = point_txt(R,"$P+Q$",rgbcolor=(0,0,0)) if Lines==0: g=curve elif Lines ==1: g=curve+l1 elif Lines == 2: g=curve+l1+l2 if marked_points: g=g+p1+p2+p3+p4 if P != Q: g=g+textp1+textp2+textp3 else: g=g+textp1+textp3 g.axes_range(xmin=-5,xmax=5,ymin=-13,ymax=13) show(g,axes = Axes) }}} {{attachment:PointAddEllipticCurve.png}} == Plotting an elliptic curve over a finite field == {{{#!sagecell E = EllipticCurve('37a') @interact def _(p=slider(prime_range(1000), default=389)): show(E) print "p = %s"%p show(E.change_ring(GF(p)).plot(),xmin=0,ymin=0) }}} {{attachment:ellffplot.png}} = Cryptography = == The Diffie-Hellman Key Exchange Protocol == by Timothy Clemans and William Stein {{{#!sagecell @interact def diffie_hellman(bits=slider(8, 513, 4, 8, 'Number of bits', False), button=selector(["Show new example"],label='',buttons=True)): maxp = 2 ^ bits p = random_prime(maxp) k = GF(p) if bits > 100: g = k(2) else: g = k.multiplicative_generator() a = ZZ.random_element(10, maxp) b = ZZ.random_element(10, maxp) html(""" <style> .gamodp, .gbmodp { color:#000; padding:5px } .gamodp { background:#846FD8 } .gbmodp { background:#FFFC73 } .dhsame { color:#000; font-weight:bold } </style> <h2 style="color:#000;font-family:Arial, Helvetica, sans-serif">%s-Bit Diffie-Hellman Key Exchange</h2> <ol style="color:#000;font-family:Arial, Helvetica, sans-serif"> <li>Alice and Bob agree to use the prime number p = %s and base g = %s.</li> <li>Alice chooses the secret integer a = %s, then sends Bob (<span class="gamodp">g<sup>a</sup> mod p</span>):<br/>%s<sup>%s</sup> mod %s = <span class="gamodp">%s</span>.</li> <li>Bob chooses the secret integer b=%s, then sends Alice (<span class="gbmodp">g<sup>b</sup> mod p</span>):<br/>%s<sup>%s</sup> mod %s = <span class="gbmodp">%s</span>.</li> <li>Alice computes (<span class="gbmodp">g<sup>b</sup> mod p</span>)<sup>a</sup> mod p:<br/>%s<sup>%s</sup> mod %s = <span class="dhsame">%s</span>.</li> <li>Bob computes (<span class="gamodp">g<sup>a</sup> mod p</span>)<sup>b</sup> mod p:<br/>%s<sup>%s</sup> mod %s = <span class="dhsame">%s</span>.</li> </ol> """ % (bits, p, g, a, g, a, p, (g^a), b, g, b, p, (g^b), (g^b), a, p, (g^ b)^a, g^a, b, p, (g^a)^b)) }}} {{attachment:dh.png}} = Other = == Continued Fraction Plotter == by William Stein {{{#!sagecell @interact def _(number=e, ymax=selector([5,20,..,400],nrows=2), clr=Color('purple'), prec=[500,1000,..,5000]): c = list(continued_fraction(RealField(prec)(number))); print c show(line([(i,z) for i, z in enumerate(c)],rgbcolor=clr),ymax=ymax,figsize=[10,2]) }}} {{attachment:contfracplot.png}} == Computing Generalized Bernoulli Numbers == by William Stein (Sage-2.10.3) {{{#!sagecell @interact def _(m=selector([1..15],nrows=2), n=(7,(3..10))): G = DirichletGroup(m) s = "<h3>First n=%s Bernoulli numbers attached to characters with modulus m=%s</h3>"%(n,m) s += '<table border=1>' s += '<tr bgcolor="#edcc9c"><td align=center>$\\chi$</td><td>Conductor</td>' + \ ''.join('<td>$B_{%s,\chi}$</td>'%k for k in [1..n]) + '</tr>' for eps in G.list(): v = ''.join(['<td align=center bgcolor="#efe5cd">$%s$</td>'%latex(eps.bernoulli(k)) for k in [1..n]]) s += '<tr><td bgcolor="#edcc9c">%s</td><td bgcolor="#efe5cd" align=center>%s</td>%s</tr>\n'%( eps, eps.conductor(), v) s += '</table>' html(s) }}} {{attachment:bernoulli.png}} == Fundamental Domains of SL_2(ZZ) == by Robert Miller {{{#!sagecell L = [[-0.5, 2.0^(x/100.0) - 1 + sqrt(3.0)/2] for x in xrange(1000, -1, -1)] R = [[0.5, 2.0^(x/100.0) - 1 + sqrt(3.0)/2] for x in xrange(1000)] xes = [x/1000.0 for x in xrange(-500,501,1)] M = [[x,abs(sqrt(x^2-1))] for x in xes] fundamental_domain = L+M+R fundamental_domain = [[x-1,y] for x,y in fundamental_domain] @interact def _(gen = selector(['t+1', 't-1', '-1/t'], buttons=True,nrows=1)): global fundamental_domain if gen == 't+1': fundamental_domain = [[x+1,y] for x,y in fundamental_domain] elif gen == 't-1': fundamental_domain = [[x-1,y] for x,y in fundamental_domain] elif gen == '-1/t': new_dom = [] for x,y in fundamental_domain: sq_mod = x^2 + y^2 new_dom.append([(-1)*x/sq_mod, y/sq_mod]) fundamental_domain = new_dom P = polygon(fundamental_domain) P.ymax(1.2); P.ymin(-0.1) P.show() }}} {{attachment:fund_domain.png}} |
Contents
Integer Factorization
Divisibility Poset
by William Stein
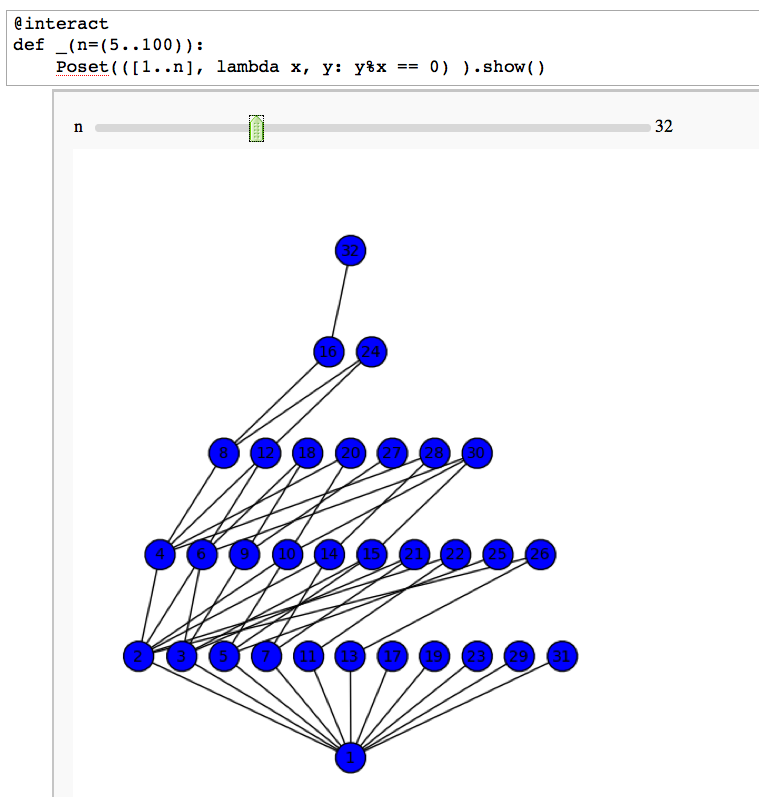
Factor Trees
by William Stein
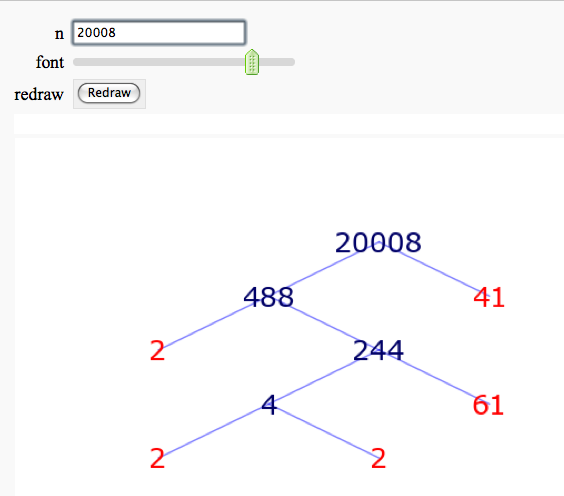
More complicated demonstration using Mathematica: http://demonstrations.wolfram.com/FactorTrees/
Factoring an Integer
by Timothy Clemans
Sage implementation of the Mathematica demonstration of the same name. http://demonstrations.wolfram.com/FactoringAnInteger/
Prime Numbers
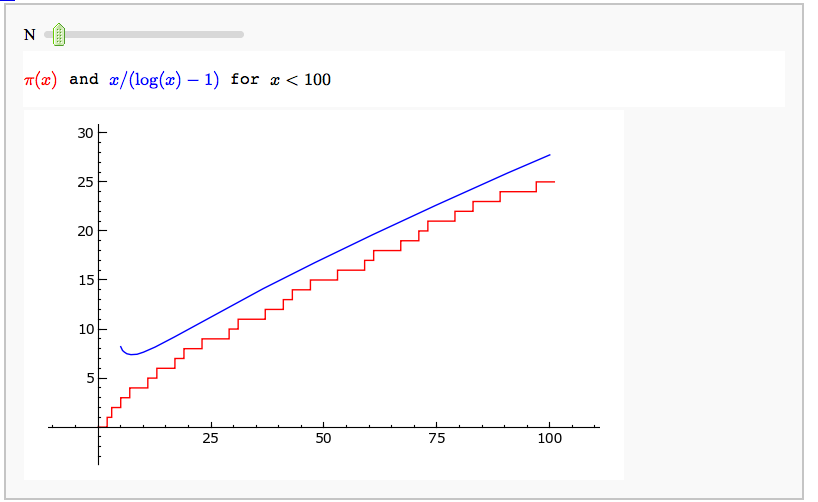
Illustrating the prime number theorem
by William Stein
Prime Spiral - Square FIXME
by David Runde
Prime Spiral - Polar
by David Runde
Modular Forms
Computing modular forms
by William Stein
Computing the cuspidal subgroup
by William Stein
A Charpoly and Hecke Operator Graph
by William Stein
Modular Arithmetic
Quadratic Residue Table FIXME
by Emily Kirkman
Cubic Residue Table FIXME
by Emily Kirkman
Cyclotomic Fields
Gauss and Jacobi Sums in Complex Plane
by Emily Kirkman
Exhaustive Jacobi Plotter
by Emily Kirkman
Elliptic Curves
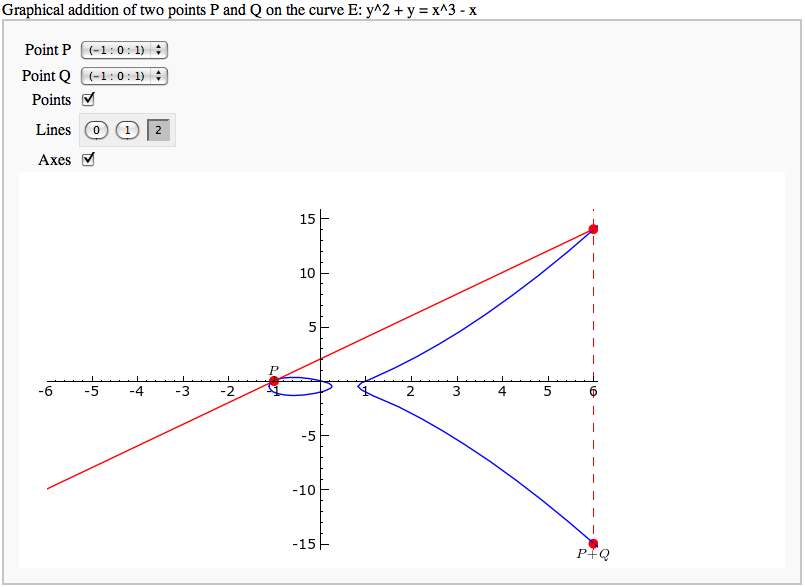
Adding points on an elliptic curve
by David Møller Hansen
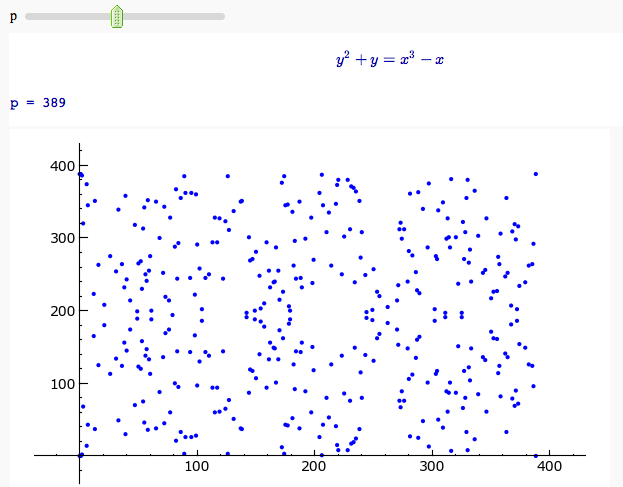
Plotting an elliptic curve over a finite field
Cryptography
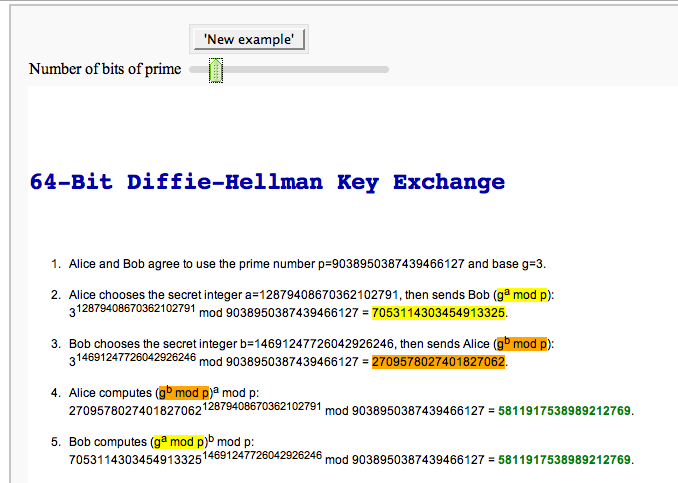
The Diffie-Hellman Key Exchange Protocol
by Timothy Clemans and William Stein
Other
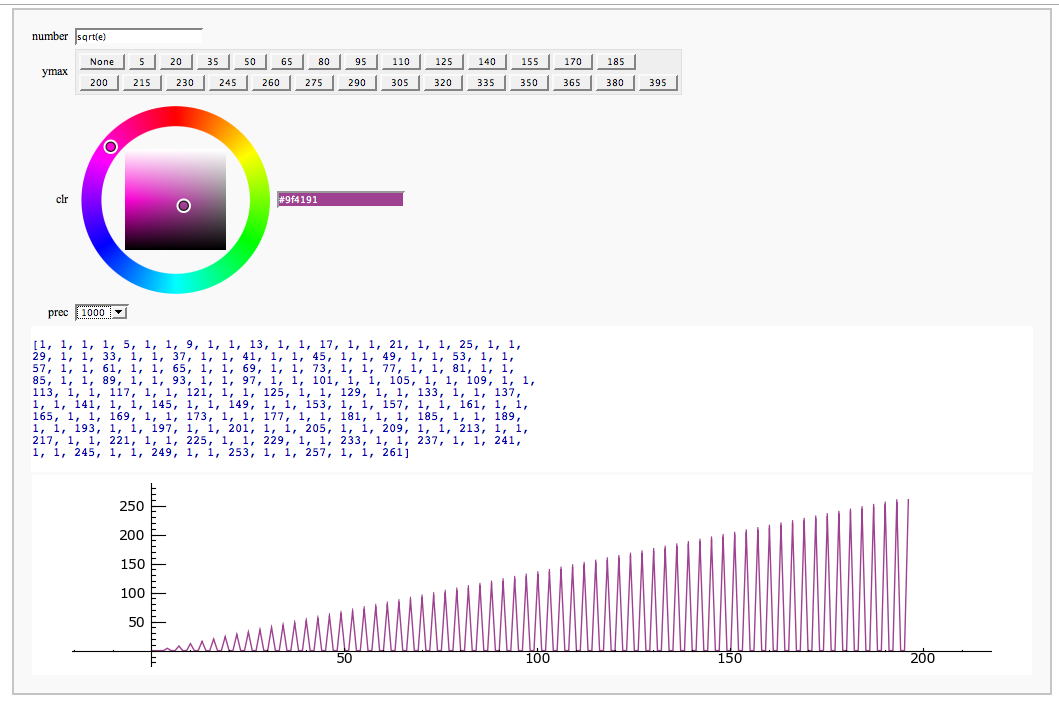
Continued Fraction Plotter
by William Stein
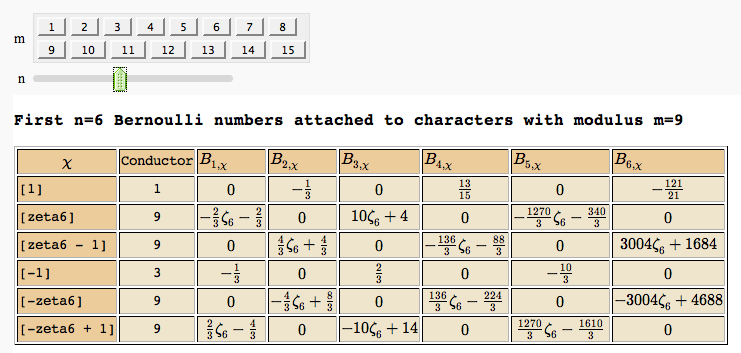
Computing Generalized Bernoulli Numbers
by William Stein (Sage-2.10.3)
Fundamental Domains of SL_2(ZZ)
by Robert Miller
