Contents
The SAGE Graph Theory Project
Introduction
We are implementing graph objects and algorithms in SAGE. The main people working on this project are Emily Kirkman and Robert Miller.
Current Status
- NetworkX base classes have been interfaced, and all functions are soon to follow.
- Jason Grout's (Brigham Young) SQL lite graph database is almost finished, and when it is done, it will be interfaced by Emily.
Jim Morrow (UW) has expressed interest in using SAGE for his summer REU on graphs. Robert is working on implementing electrical networks, which includes implementing edge weights and graphs with boundary.
- Chris Godsil (Waterloo) has expressed interest in helping design a more general discrete math package in SAGE.
Brendan McKay's isomorphism algorithm has been replicated for the open source community (it is called "nice", as opposed to "nauty").
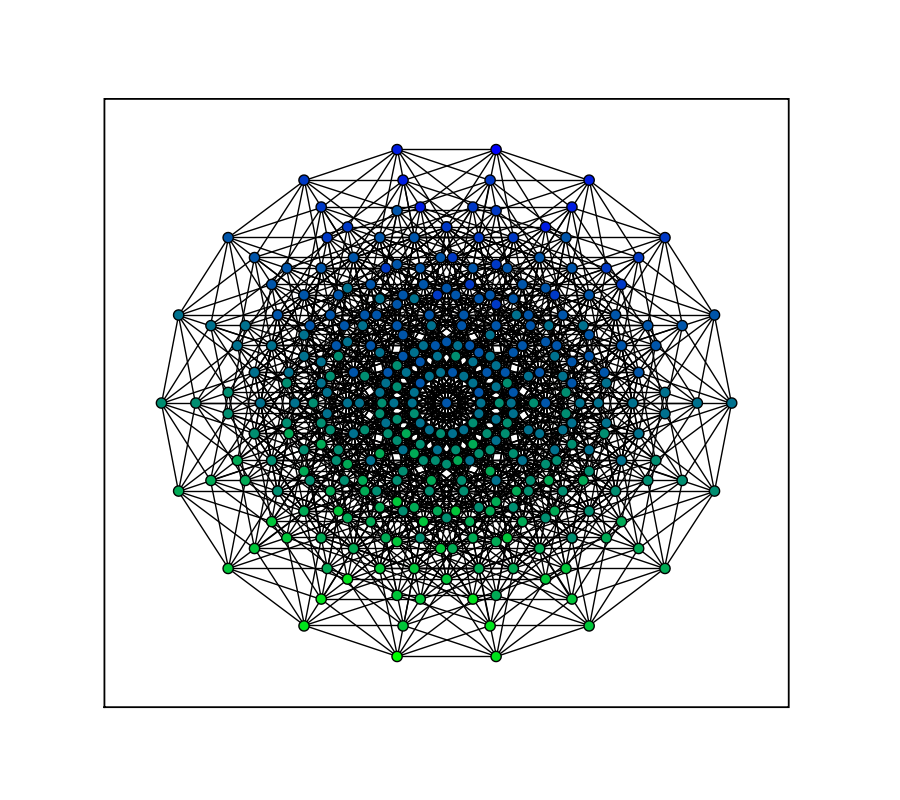
- Graph plotting has been implemented in two dimensions:
C = graphs.CubeGraph(9)
color = {}
for v in C.vertices():
    b = v.count('1')/9
    g = 1 - b
    if (0, g, b) in color: color[(0, g, b)].append(v)
    else: color[(0, g, b)] = [v]
C.show(vertex_labels=False, node_size=60, graph_border=True, color_dict=color, figsize=[9,8])
Talks
On Oct. 20, 2006, Robert gave a talk about the state of affairs for existing software which shared a few benchmarks and discussed some implementation ideas.
- On Feb. 15, 2007, Robert and Emily gave an Informal Introduction to the Graph Theory Package. This talk was essentially a review of newly available features.
On Feb. 17, 2007, Robert gave a talk at Sage Days 3.
- On Mar. 2, 2007, Robert gave a talk entitled "Opening Graph Automorphisms".
On Mar. 29, 2007, he followed up with a part two of this talk, after implementing "nice".
On Apr. 21, 2007, Emily presented a poster (ppt) introducing the SAGE graph theory package at East Coast Computer Algebra Day.
On Apr. 27, 2007, Emily gave a talk introducing the (almost complete) sqlite database.
Other wiki pages
- Surveys
Existing Software: We are always seeking additions and comments.
Existing Databases: Includes comments by Jason Grout.
- Initial Benchmarks indicated that NetworkX was the appropriate package for inclusion in SAGE. They were designed to compare the constructions and very basic functionality found in our survey of existing software.
- 2D plotting is implemented using matplotlib.
- 3D plotting via Tachyon is coming soon.
- 3D interactive viewing is on its way, via Java applets (pending some serious implementation issues).
- So far: Basic graph structures with intuitive graphics.
- Extensive educational docstrings and many graph constructors.
- Native positionings allow standard layouts and quicker plotting
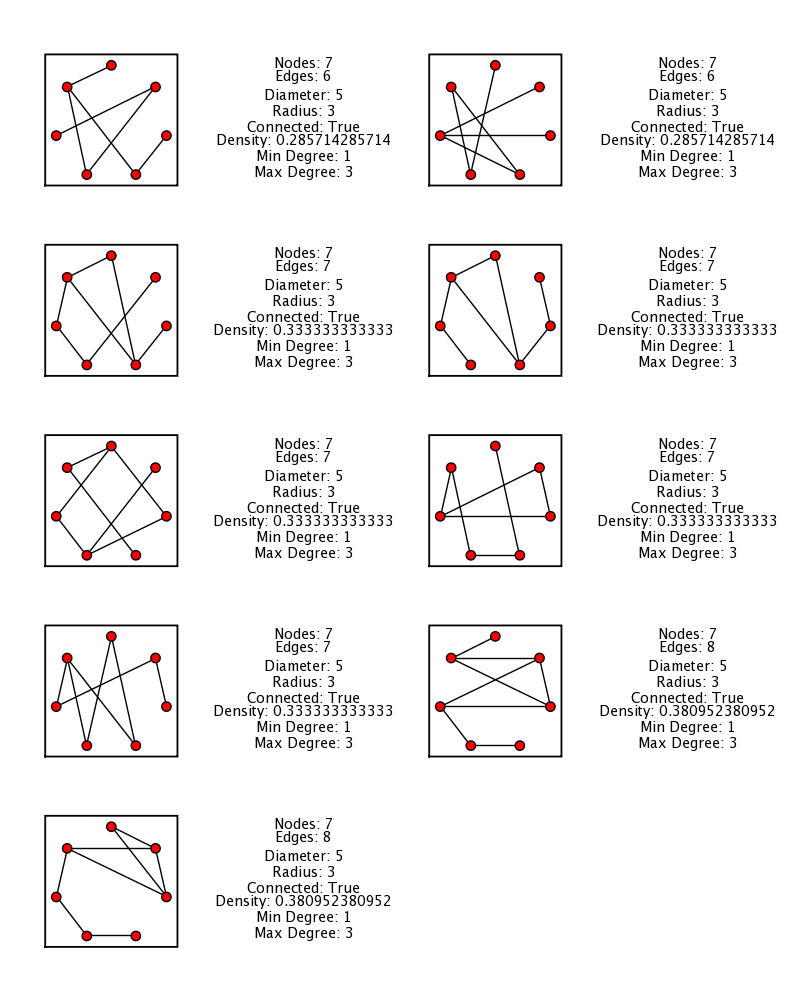
- Emily has provided a provisional database of graphs on up to seven vertices:
graphs_query.show_graphs(with_properties=True, nodes=7, diameter=5)

