Contents
Introduction
Robert Miller is working on this project. Back to main wiki
2D Plotting
- matplotlib plotting is supported (albeit awkwardly) by NetworkX. Smooth interfacing of this functionality with SAGE (especially the notebook) is almost complete. Part of this implementation was writing a NetworkX graphics primitive. In this routine, each edge is treated as a spring; after each node is randomly placed on the plot screen, fifty iterations allow the "springs" to align themselves in equilibrium, often revealing geometric symmetries of the graph (try plotting a Platonic solid...). There are also options to pre-specify vertex positions: the graph class now comes with an optional positioning variable, so that if a user likes to think of a graph in a certain visual layout, that layout can be made part of the graph information. Boundary nodes default to plot a different color, and edge labels will soon be displayed. Pending another graphics primitive, graphics objects can be associated with nodes so that the plots show up in place of the nodes when a graph is displayed.
- Examples:
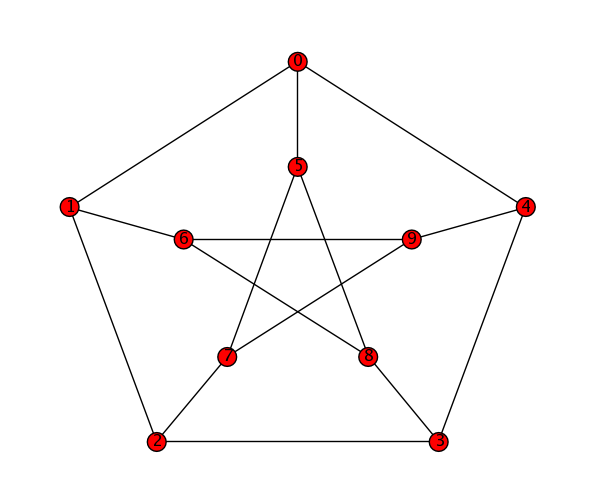
graphs.PetersenGraph().show()
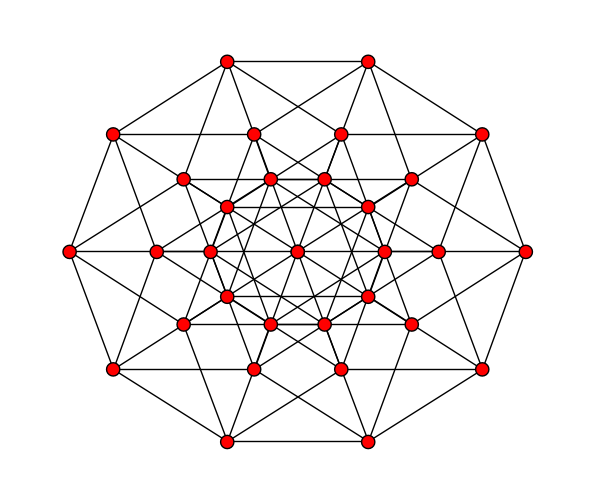
graphs.CubeGraph(5).show(vertex_labels=False, node_size=100)
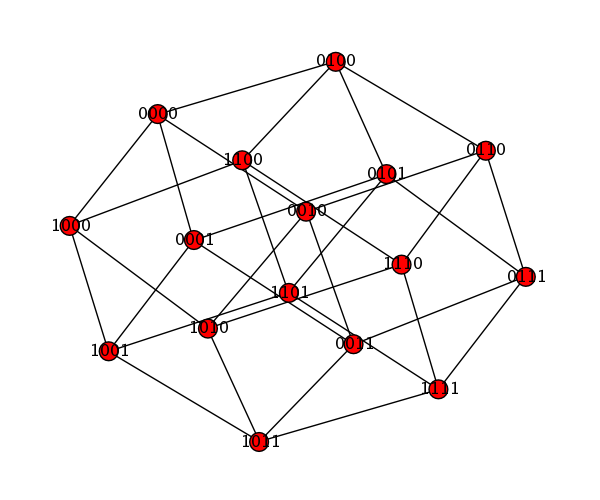
graphs.CubeGraph(4).show(layout='spring')
d = {}
for j in range(14):
    h = (j/14)*6
    i = floor(h)
    a = h - i; b = 1 - a # a==var3, b==var2
    r = { 0: 1, 1: b, 2: 0, 3: 0, 4: a, 5: 1 }[i]
    g = { 0: a, 1: 1, 2: 1, 3: b, 4: 0, 5: 0 }[i]
    b = { 0: 0, 1: 0, 2: a, 3: 1, 4: 1, 5: b }[i]
    d[(r, g, b)] = [j]
graphs.HeawoodGraph().show(color_dict=d)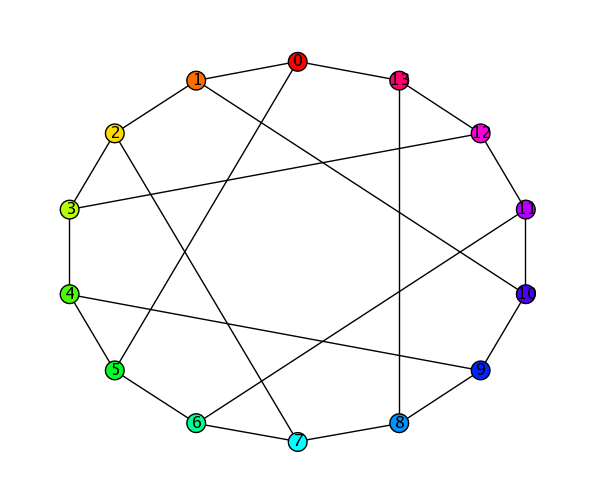
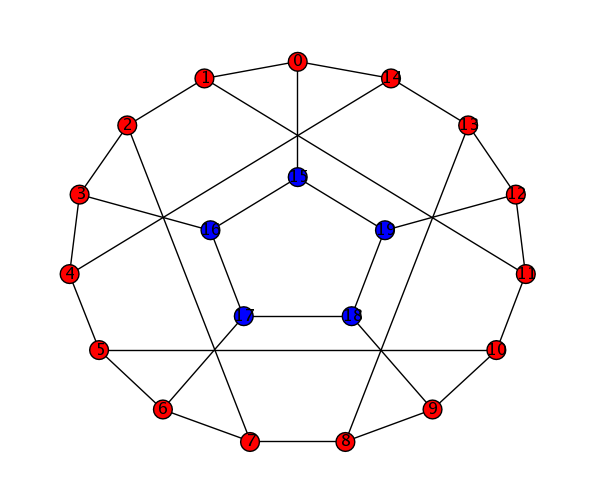
G = graphs.FlowerSnark()
G.set_boundary([15,16,17,18,19])
G.show()
C = graphs.CubeGraph(9)
color = {}
for v in C.vertices():
    b = v.count('1')/9
    g = 1 - b
    if color.has_key((0, g, b)): color[(0, g, b)].append(v)
    else: color[(0, g, b)] = [v]
C.show(vertex_labels=False, node_size=60, graph_border=True, color_dict=color, figsize=[9,8])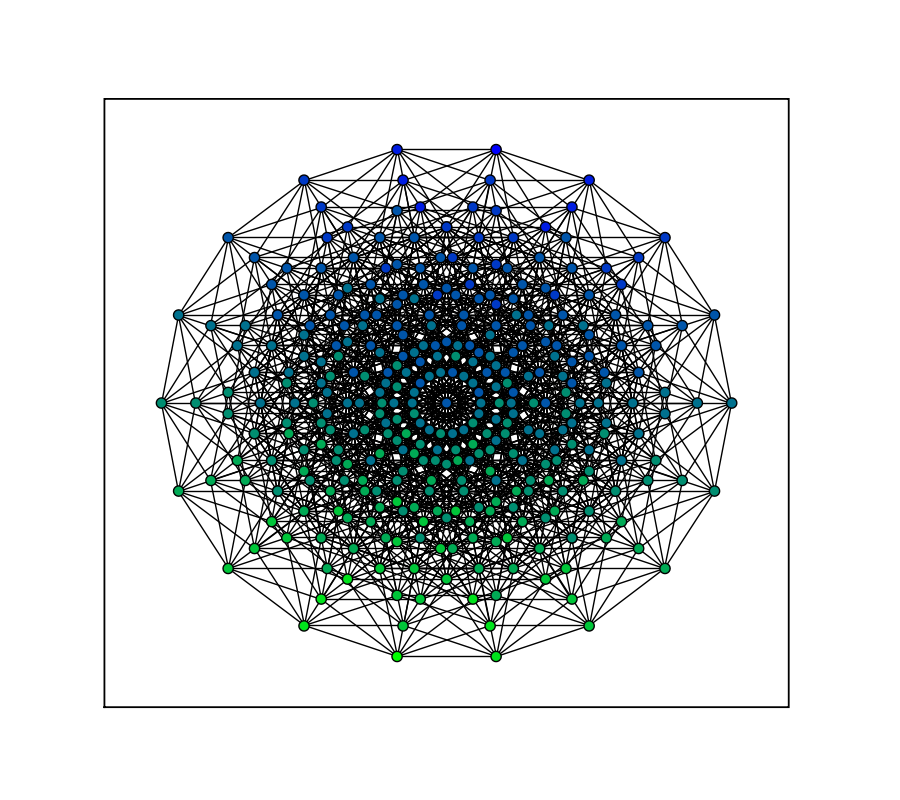
3D Plotting
- Tachyon plots are here!!
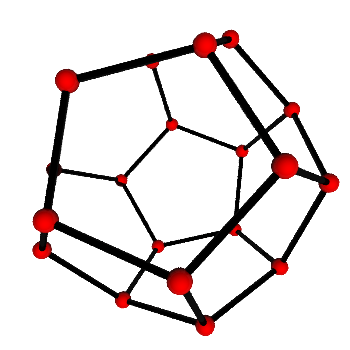
- The Dodecahedron,
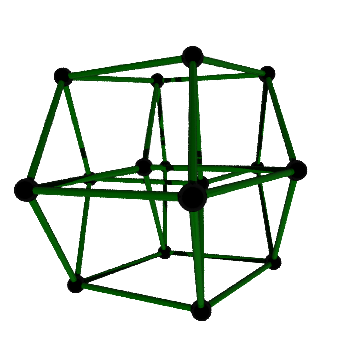
- and the Four Cube
- Interactive graph viewing (i.e. spin it around...) will hopefully be available by March.
- Interactive graph editing is on Chris Godsil's wishlist; it will be implemented via Java applet some time in the future.
